1: How Many Babies Are Born in the United States?
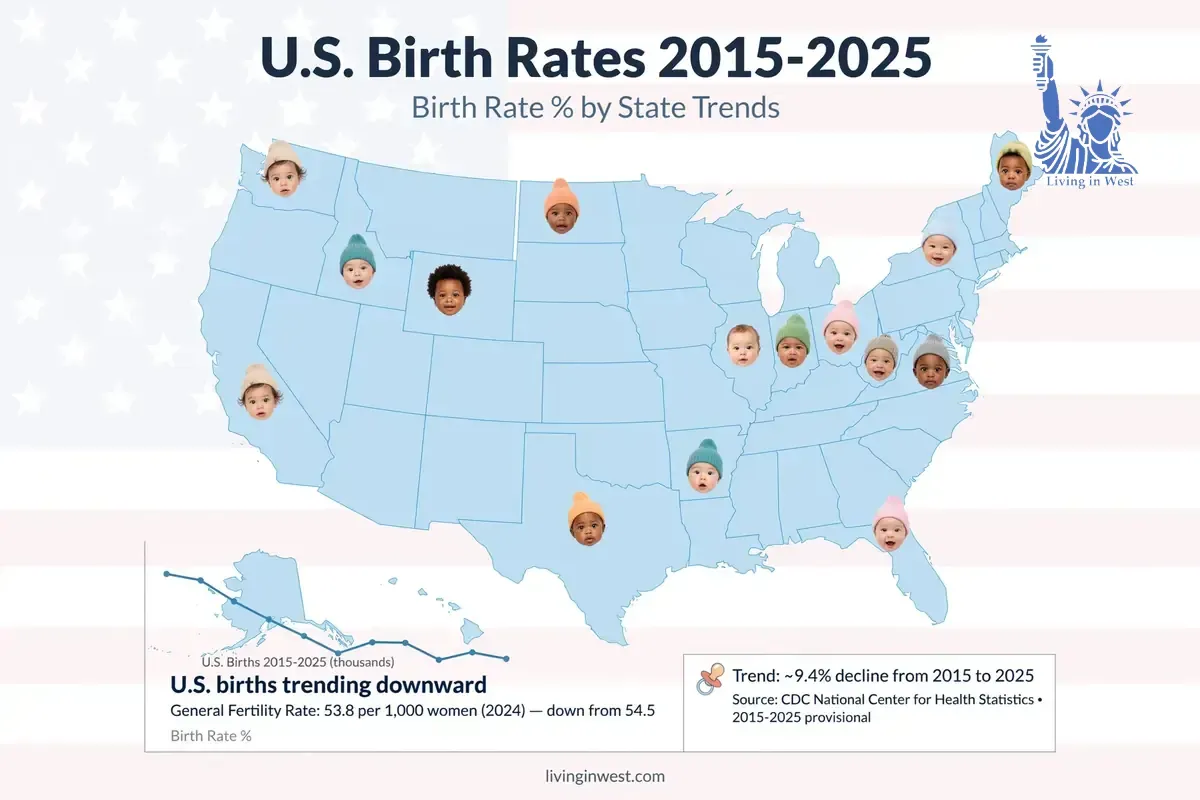
The number of babies born in the United States has changed noticeably over the past decade.
In 2015, the country recorded 3,978,497 births, according to final data from the CDC's National Center for Health Statistics. By 2020, annual births had fallen to 3,613,647. Births then increased in 2021, while 2022 was essentially unchanged from the previous year.
The decline became more noticeable again in 2023, when the United States recorded 3,596,017 births, the lowest annual total in the recent period covered by the CDC's final data.
There was a modest rebound in 2024, with 3,628,934 births. However, the general fertility rate still declined to 53.8 births per 1,000 women ages 15–44.
U.S. births by year
| Year | U.S. births | Status |
|---|---|---|
| 2015 | 3,977,745 | Final |
| 2016 | 3,945,875 | Final |
| 2017 | 3,855,500 | Final |
| 2018 | 3,791,712 | Final |
| 2019 | 3,747,540 | Final |
| 2020 | 3,613,647 | Final |
| 2021 | 3,664,292 | Final |
| 2022 | 3,667,758 | Final |
| 2023 | 3,596,017 | Final |
| 2024 | 3,628,934 | Final |
| 2025 | 3,606,400 | Provisional |
| 2026 | Not yet available as a full-year total | Provisional/current-year data |
The 2015 figure comes from the CDC's final 2015 birth report. The 2021 and 2022 figures are also from final NCHS data, with CDC specifically describing the 2022 number as essentially unchanged from 2021.
For 2025, CDC reported 3,606,400 provisional births, down 1% from 2024.
The important trend
The overall pattern is not a straight line downward.
Instead, the U.S. experienced:
- A gradual decline from 2015 through 2020
- A 1% increase in births in 2021
- Virtually no change in 2022
- Another decline in 2023
- A small increase in 2024
- A provisional decline again in 2025
This makes the decade-long trend more complicated than simply saying that American births have fallen every year.
2: California and Texas Lead the U.S. in Total Births
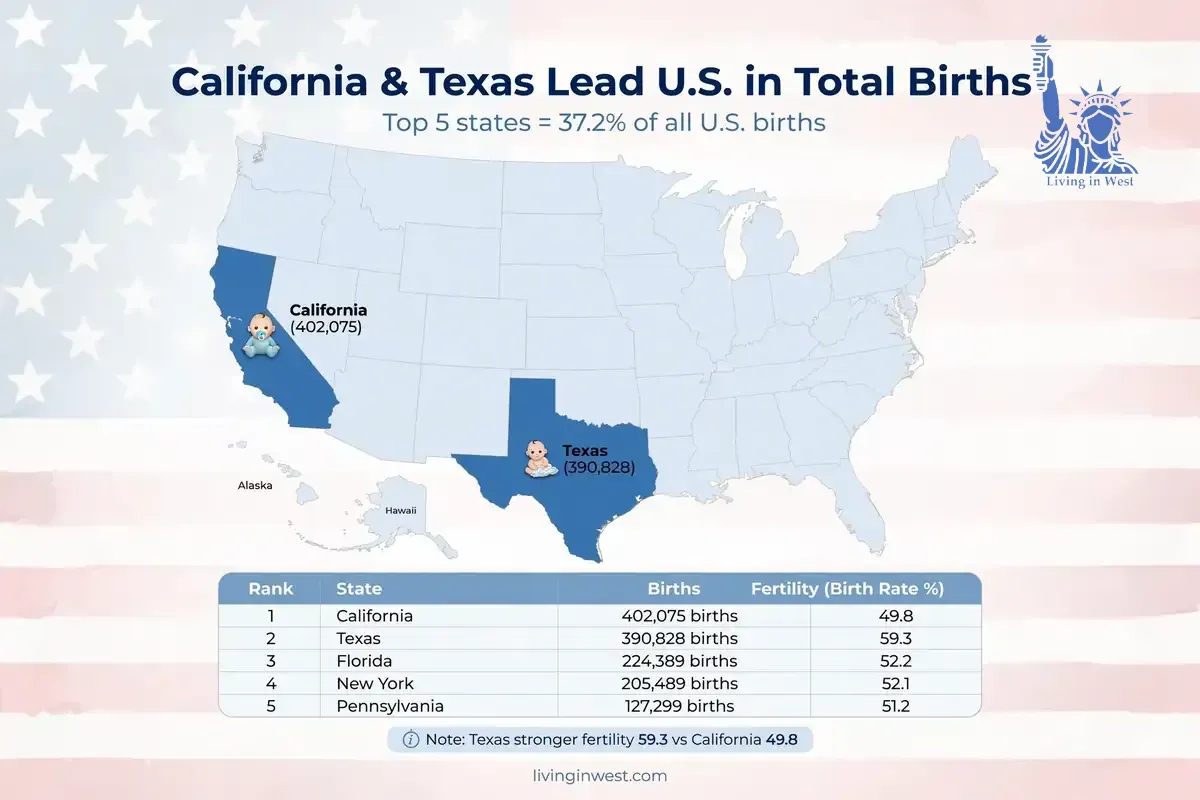
When it comes to the number of babies born, California and Texas are in a different league from most other states.
California recorded 402,075 births in 2024, the highest total in the country.
Texas followed with 390,828 births.
Florida and New York were the next two states, followed by Pennsylvania.
Top 10 states by number of births in 2024
| Rank | State | Births | Fertility rate |
|---|---|---|---|
| 1 | California | 402,075 | 49.8 |
| 2 | Texas | 390,828 | 59.3 |
| 3 | Florida | 224,389 | 52.2 |
| 4 | New York | 205,489 | 52.1 |
| 5 | Pennsylvania | 127,299 | 51.2 |
| 6 | Ohio | 126,795 | 55.6 |
| 7 | Georgia | 126,437 | 54.7 |
| 8 | Illinois | 125,731 | 49.7 |
| 9 | North Carolina | 122,856 | 55.8 |
| 10 | New Jersey | 101,372 | 55.7 |
CDC's 2024 state data confirm these birth totals and fertility rates.
One reason California and Texas produce so many births is simple: both have enormous populations.
But the fertility-rate column tells a different story.
Texas, for example, had a fertility rate of 59.3, considerably higher than California's 49.8. This means Texas is strong on both population size and fertility, while California's enormous birth total is driven heavily by its population base.
The five largest birth-producing states — California, Texas, Florida, New York and Pennsylvania — accounted for approximately 37.2% of all U.S. births in 2024.
That is a remarkably large share concentrated in only five states.
3: What Changed Between 2015 and 2025?
Looking at a single year can be misleading.
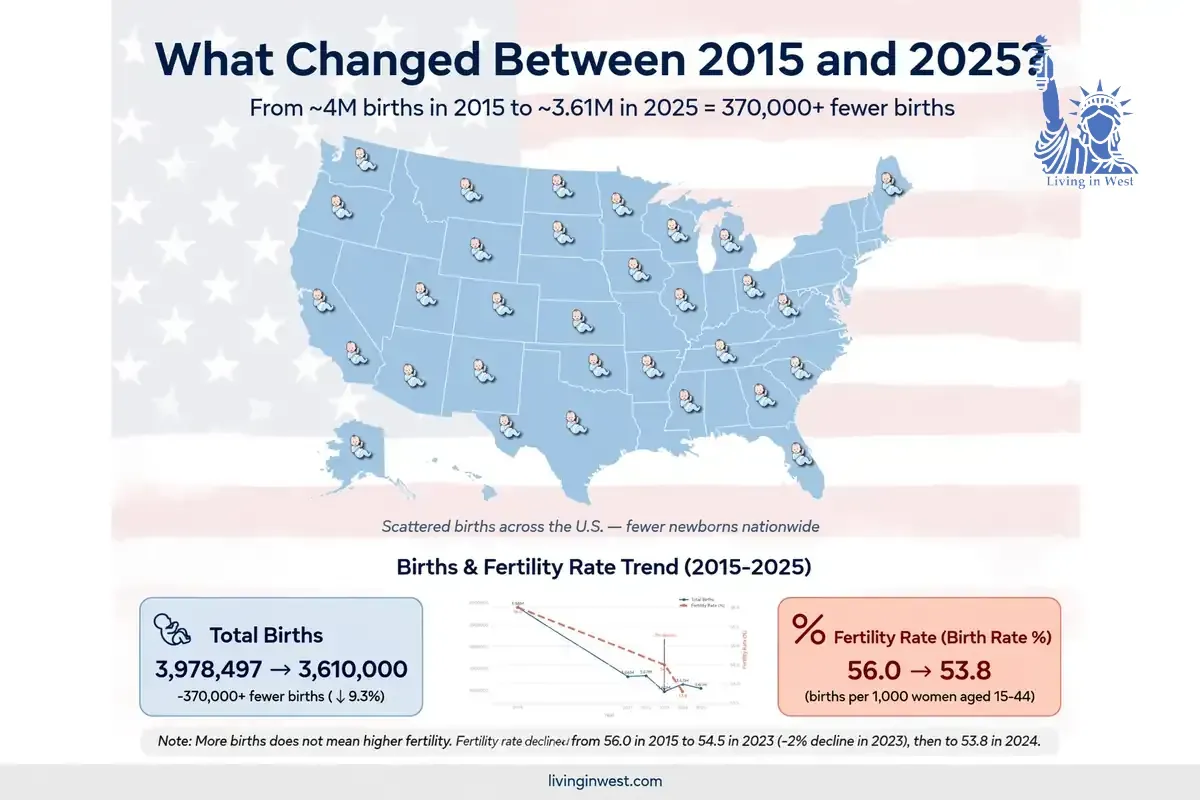
The longer 2015–2025 period shows that the U.S. has experienced a substantial change in the number of births.
The country went from nearly 4 million births in 2015 to approximately 3.61 million provisional births in 2025.
That is a difference of more than 370,000 births.
The biggest disruption came around 2020, when births fell sharply. In 2021, births increased by about 1%, but the following year was essentially unchanged. CDC reported that the 2022 total of 3,667,758 was not significantly different from 2021's 3,664,292.
The decline resumed in 2023.
2023 was an important turning point
The United States recorded:
2021: 3,664,292 births
2022: 3,667,758 births
2023: 3,596,017 births
CDC described the 2023 decline as about 2% from 2022. The general fertility rate also dropped from 56.0 to 54.5 births per 1,000 women ages 15–44.
Then came 2024.
Births increased to 3,628,934, but the general fertility rate declined again, reaching 53.8.
That difference matters.
More births does not necessarily mean higher fertility
A state or country can record more births simply because its population is larger.
Similarly, a state can have a high fertility rate but relatively few total births because it has a small population.
This is why serious demographic analysis should always look at both:
Total births
and
Fertility rate
rather than treating them as interchangeable measures.
4: Births and Fertility Rates Across All 50 States
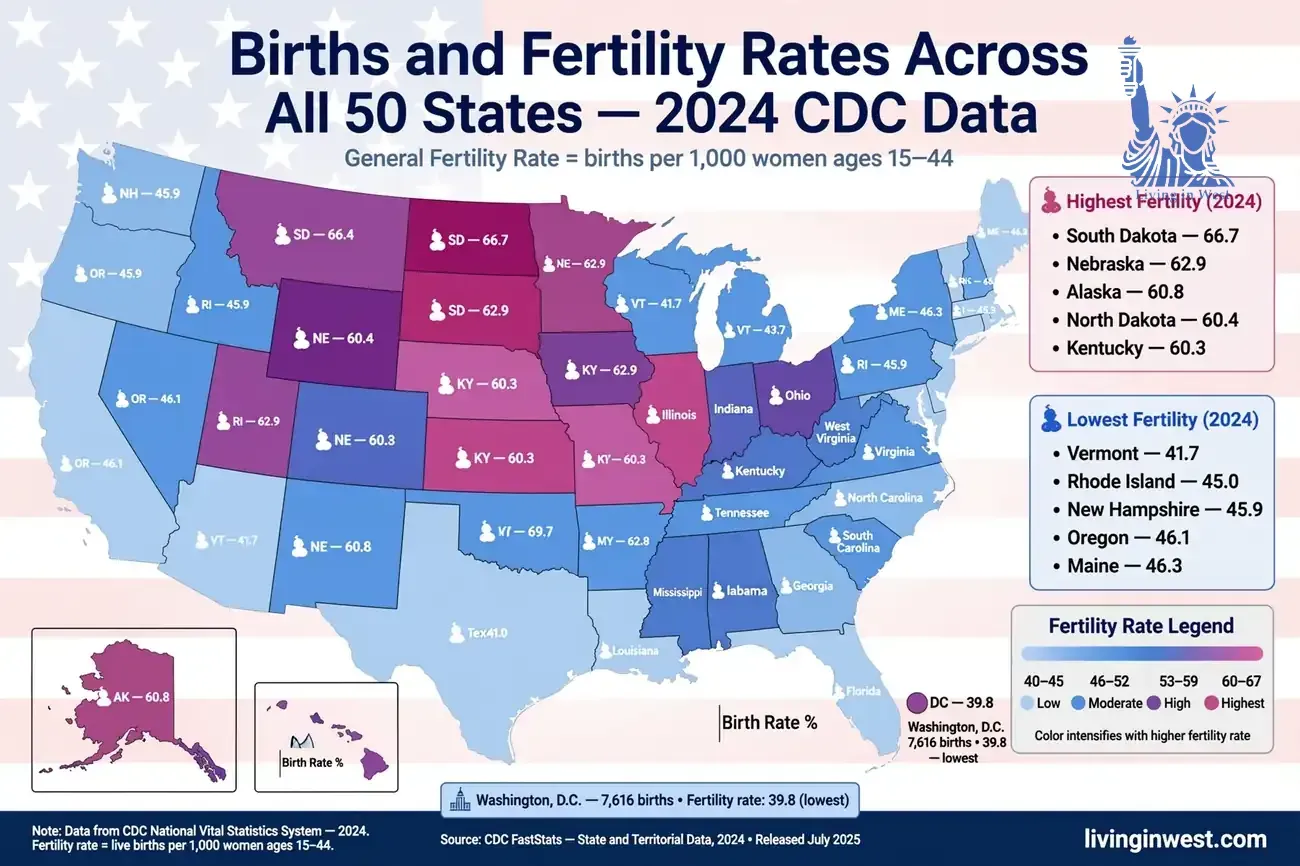
The latest complete state-level comparison comes from the CDC's final 2024 natality data.
CDC defines the general fertility rate as the number of live births per 1,000 women ages 15–44.
Alabama through Kentucky
| State | 2024 births | Fertility rate |
|---|---|---|
| Alabama | 57,934 | 57.2 |
| Alaska | 8,943 | 60.8 |
| Arizona | 78,711 | 53.2 |
| Arkansas | 35,395 | 58.8 |
| California | 402,075 | 49.8 |
| Colorado | 64,268 | 51.6 |
| Connecticut | 34,599 | 48.9 |
| Delaware | 10,550 | 53.7 |
| Florida | 224,389 | 52.2 |
| Georgia | 126,437 | 54.7 |
| Hawaii | 14,917 | 56.6 |
| Idaho | 23,276 | 58.6 |
| Illinois | 125,731 | 49.7 |
| Indiana | 80,257 | 59.1 |
| Iowa | 36,436 | 58.8 |
| Kansas | 33,984 | 58.3 |
| Kentucky | 52,913 | 60.3 |
Source: CDC National Vital Statistics System, 2024 state natality data.
Louisiana through South Carolina
| State | 2024 births | Fertility rate |
|---|---|---|
| Alabama | 57,934 | 57.2 |
| Alaska | 8,943 | 60.8 |
| Arizona | 78,711 | 53.2 |
| Arkansas | 35,395 | 58.8 |
| California | 402,075 | 49.8 |
| Colorado | 64,268 | 51.6 |
| Connecticut | 34,599 | 48.9 |
| Delaware | 10,550 | 53.7 |
| Florida | 224,389 | 52.2 |
| Georgia | 126,437 | 54.7 |
| Hawaii | 14,917 | 56.6 |
| Idaho | 23,276 | 58.6 |
| Illinois | 125,731 | 49.7 |
| Indiana | 80,257 | 59.1 |
| Iowa | 36,436 | 58.8 |
| Kansas | 33,984 | 58.3 |
| Kentucky | 52,913 | 60.3 |
Source: CDC/NCHS 2024 state data.
South Dakota through Wyoming
| State | 2024 births | Fertility rate |
|---|---|---|
| South Dakota | 11,451 | 66.7 |
| Tennessee | 83,833 | 58.5 |
| Texas | 390,828 | 59.3 |
| Utah | 46,664 | 59.9 |
| Vermont | 5,023 | 41.7 |
| Virginia | 94,054 | 53.7 |
| Washington | 83,118 | 51.3 |
| West Virginia | 17,022 | 54.3 |
| Wisconsin | 59,686 | 52.8 |
| Wyoming | 6,089 | 54.8 |
Source: CDC National Vital Statistics System, final 2024 state birth data.
What about Washington, D.C.?
Washington, D.C. is not a state and should therefore be kept separate from the 50-state ranking.
In 2024, D.C. recorded 7,616 births and had a fertility rate of 39.8 births per 1,000 women ages 15–44.
That means D.C. had a lower fertility rate than any of the 50 states in this dataset.
5: Which States Have the Highest Fertility Rates?
The ranking changes dramatically when the question changes from:
"Which states have the most births?"
to:
"Which states have the highest fertility rates?"
The answer is not California.
It is South Dakota.
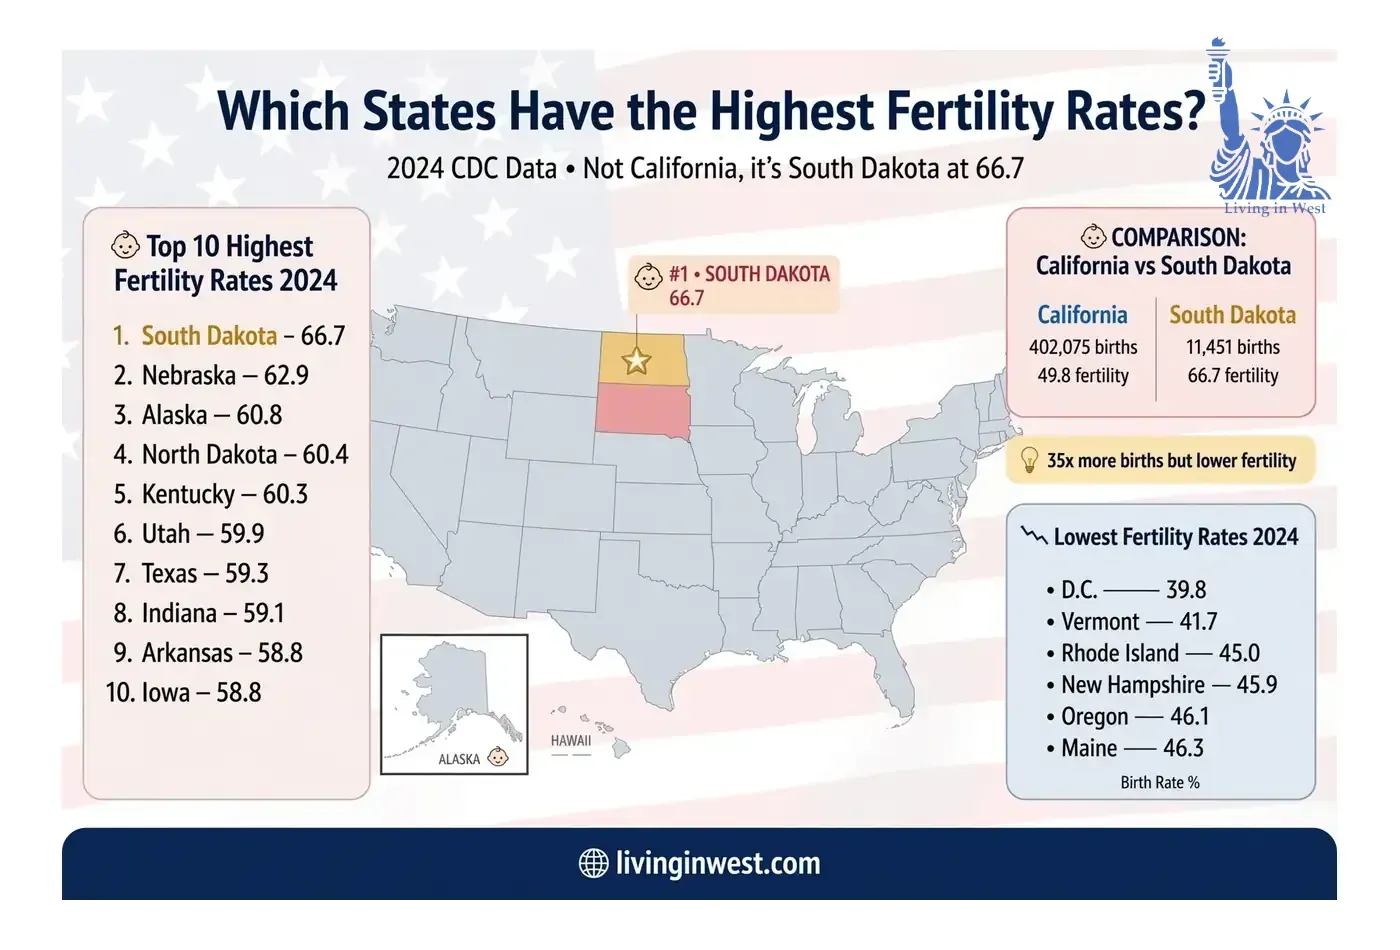
In 2024, South Dakota had a fertility rate of 66.7 births per 1,000 women ages 15–44, the highest among the states.
States with the highest fertility rates in 2024
| Rank | State | Fertility rate |
|---|---|---|
| 1 | South Dakota | 66.7 |
| 2 | Nebraska | 62.9 |
| 3 | Alaska | 60.8 |
| 4 | North Dakota | 60.4 |
| 5 | Kentucky | 60.3 |
| 6 | Utah | 59.9 |
| 7 | Texas | 59.3 |
| 8 | Indiana | 59.1 |
| 9 | Arkansas | 58.8 |
| 10 | Iowa | 58.8 |
CDC's 2024 state fertility data place South Dakota at the top, followed by Nebraska and Alaska.
At the other end, Vermont recorded a fertility rate of 41.7, followed by Rhode Island at 45.0, New Hampshire at 45.9, Oregon at 46.1 and Maine at 46.3.
D.C. was lower still at 39.8, but it is not included in the state ranking because it is a federal district.
Why is the distinction important?
Consider California and South Dakota.
California:
402,075 births
49.8 fertility rate
South Dakota:
11,451 births
66.7 fertility rate
California has more than 35 times as many births, but South Dakota has a much higher fertility rate.
Neither number is "better." They simply answer different demographic questions.
6: Population Growth Is Changing the U.S. Birth Map
Births are only one part of population change.
The other major factor is migration.
This becomes particularly important when looking at states such as Texas, Florida, North Carolina and South Carolina.
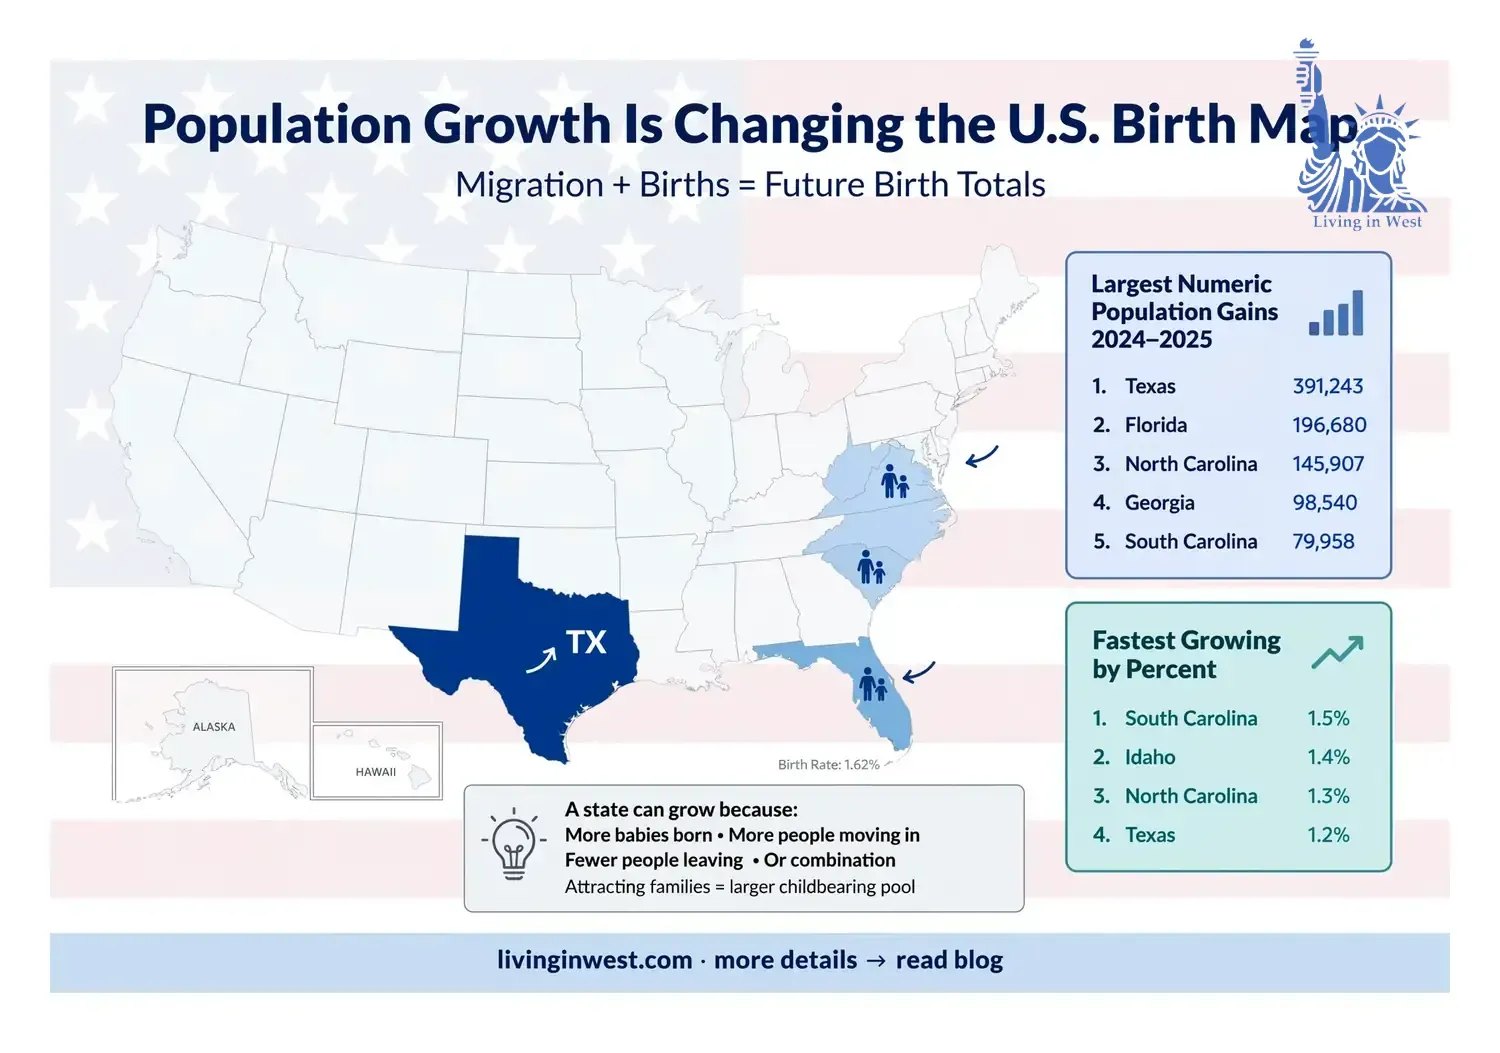
According to the U.S. Census Bureau's Vintage 2025 estimates, Texas added approximately 391,243 residents between July 2024 and July 2025, the largest numeric population increase of any state. Florida added 196,680, while North Carolina added 145,907.
States with the largest numeric population gains, 2024–2025
| Rank | State | Population gain |
|---|---|---|
| 1 | Texas | 391,243 |
| 2 | Florida | 196,680 |
| 3 | North Carolina | 145,907 |
| 4 | Georgia | 98,540 |
| 5 | South Carolina | 79,958 |
| 6 | Washington | 73,062 |
| 7 | Arizona | 67,394 |
| 8 | Tennessee | 63,785 |
| 9 | Virginia | 60,465 |
| 10 | New Jersey | 41,861 |
The fastest-growing states by percentage were led by South Carolina at 1.5%, followed by Idaho at 1.4%, North Carolina at 1.3% and Texas at 1.2%.
This creates an important demographic distinction.
A state can grow because:
- More babies are being born
- More people are moving into the state
- Fewer people are leaving
- Or a combination of these factors
For future birth totals, population growth matters because a state that attracts families and younger adults can potentially maintain a larger pool of people in childbearing ages.
| Rank | State | 2025 population |
|---|---|---|
| 1 | California | 39,355,309 |
| 2 | Texas | 31,709,821 |
| 3 | Florida | 23,462,518 |
| 4 | New York | 20,002,427 |
| 5 | Pennsylvania | 13,059,432 |
| 6 | Illinois | 12,719,141 |
| 7 | Ohio | 11,900,510 |
| 8 | Georgia | 11,302,748 |
| 9 | North Carolina | 11,197,968 |
| 10 | Michigan | 10,127,884 |
7: Why Texas Is One of the Most Important Birth States
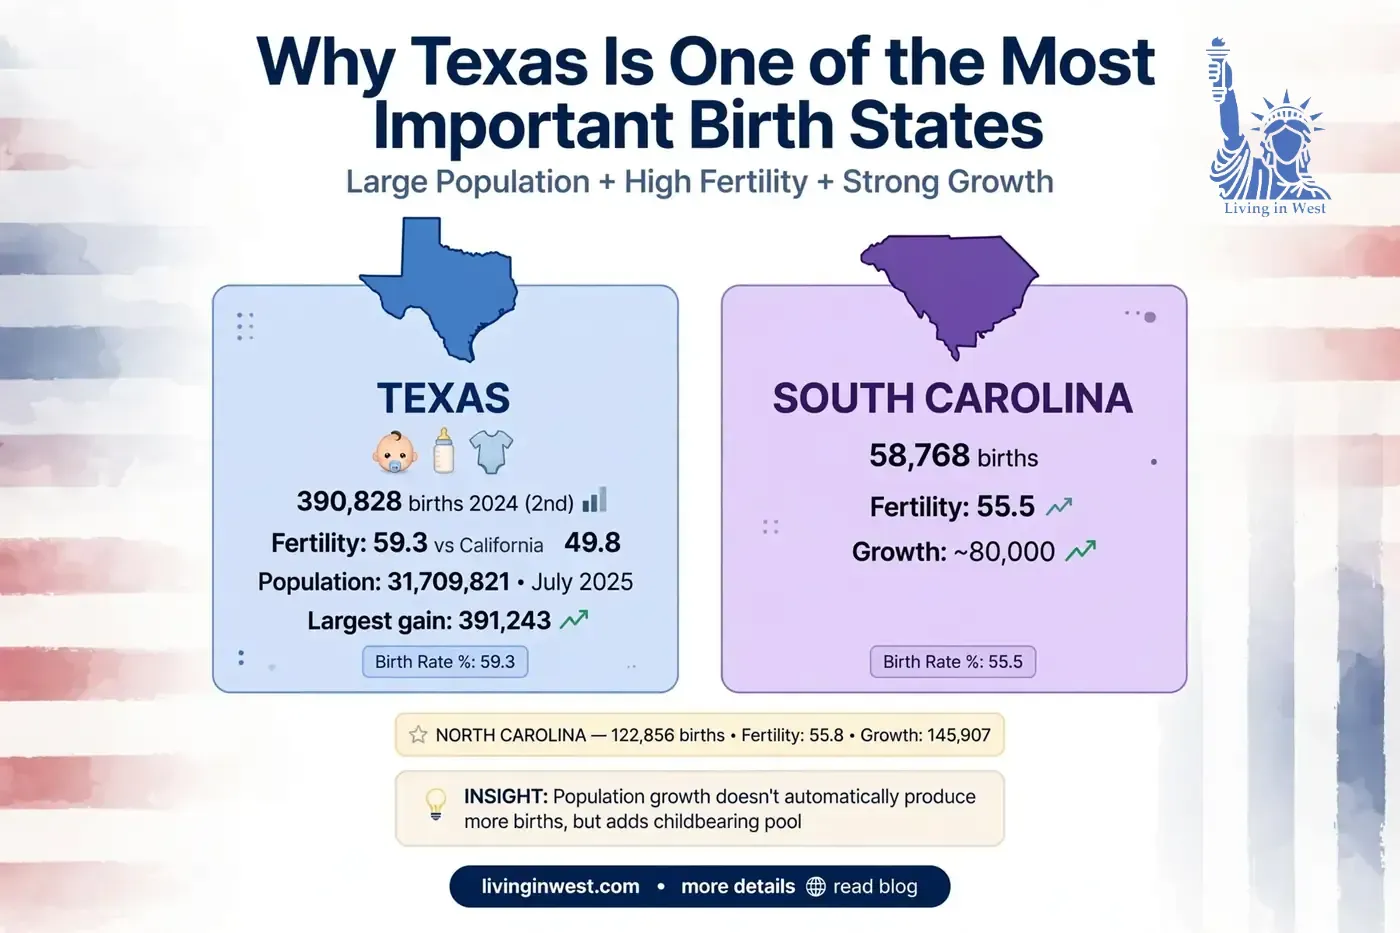
Texas is particularly interesting because it combines three major demographic characteristics.
It has:
A very large population
A relatively high fertility rate
Strong population growth
Texas recorded 390,828 births in 2024, second only to California. Its fertility rate was 59.3, well above California's 49.8.
The Census Bureau estimated Texas's population at 31,709,821 on July 1, 2025. The state also recorded the nation's largest numeric population gain between 2024 and 2025.
This combination makes Texas especially important when looking at America's future population.
North Carolina and South Carolina are also worth watching
North Carolina had 122,856 births in 2024 and a fertility rate of 55.8.
South Carolina recorded 58,768 births and had a fertility rate of 55.5.
Both states have also been experiencing strong population growth.
North Carolina's population increased by about 145,907 people between July 2024 and July 2025, while South Carolina grew by nearly 80,000 residents.
That does not mean population growth automatically produces more births.
But it does mean these states are adding residents at a time when many parts of the country are experiencing slower demographic growth.
8: What the 2026 Data Actually Tell Us
The year 2026 needs to be handled carefully.
There is not yet a complete official 2026 annual birth total.
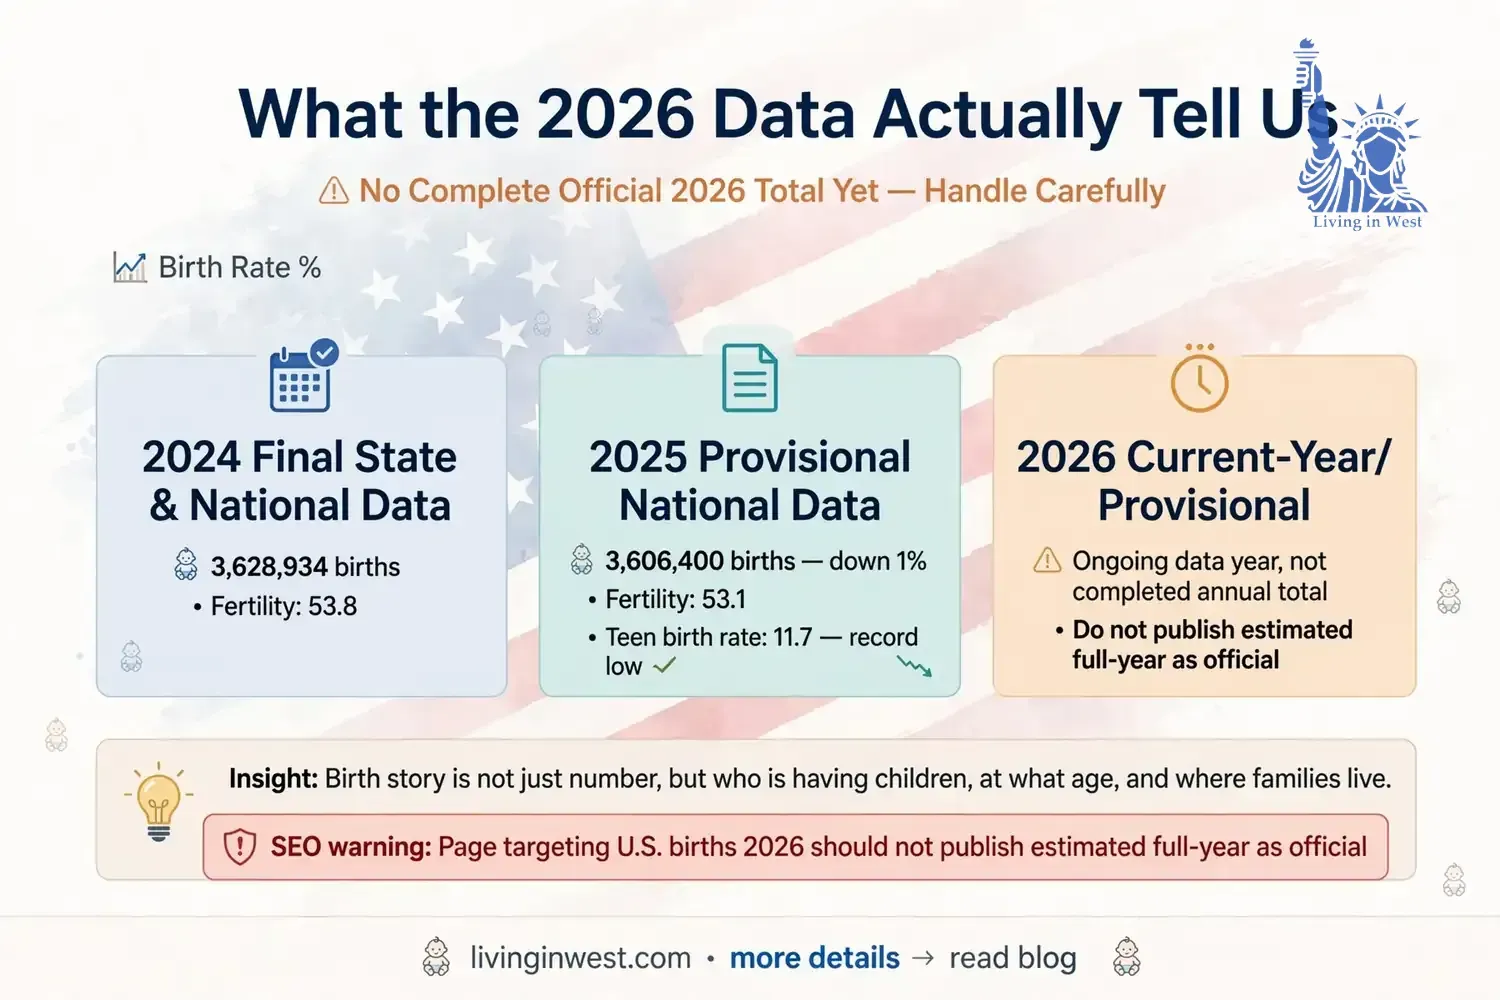
The latest complete annual state comparison is based on final 2024 CDC data. CDC also has provisional 2025 national data, while 2026 is still an ongoing data year.
This distinction is important for SEO as well as accuracy.
A page targeting "U.S. births 2026" should not publish an estimated full-year number and present it as official.
Instead, the article should clearly distinguish:
2024 — final state and national data
2025 — provisional national data
2026 — current-year/provisional data, not a completed annual total
CDC's 2025 provisional report found 3,606,400 births, down 1% from 2024. The general fertility rate fell to 53.1 births per 1,000 women ages 15–44.
Teen births continued to decline as well. CDC reported a provisional 2025 teen birth rate of 11.7 births per 1,000 females ages 15–19, another record low.
These trends suggest that the U.S. birth story is not simply about the number of babies born each year.
It is also about who is having children, at what age, and where those families live.
9: What the Birth Trends Mean for America's Future
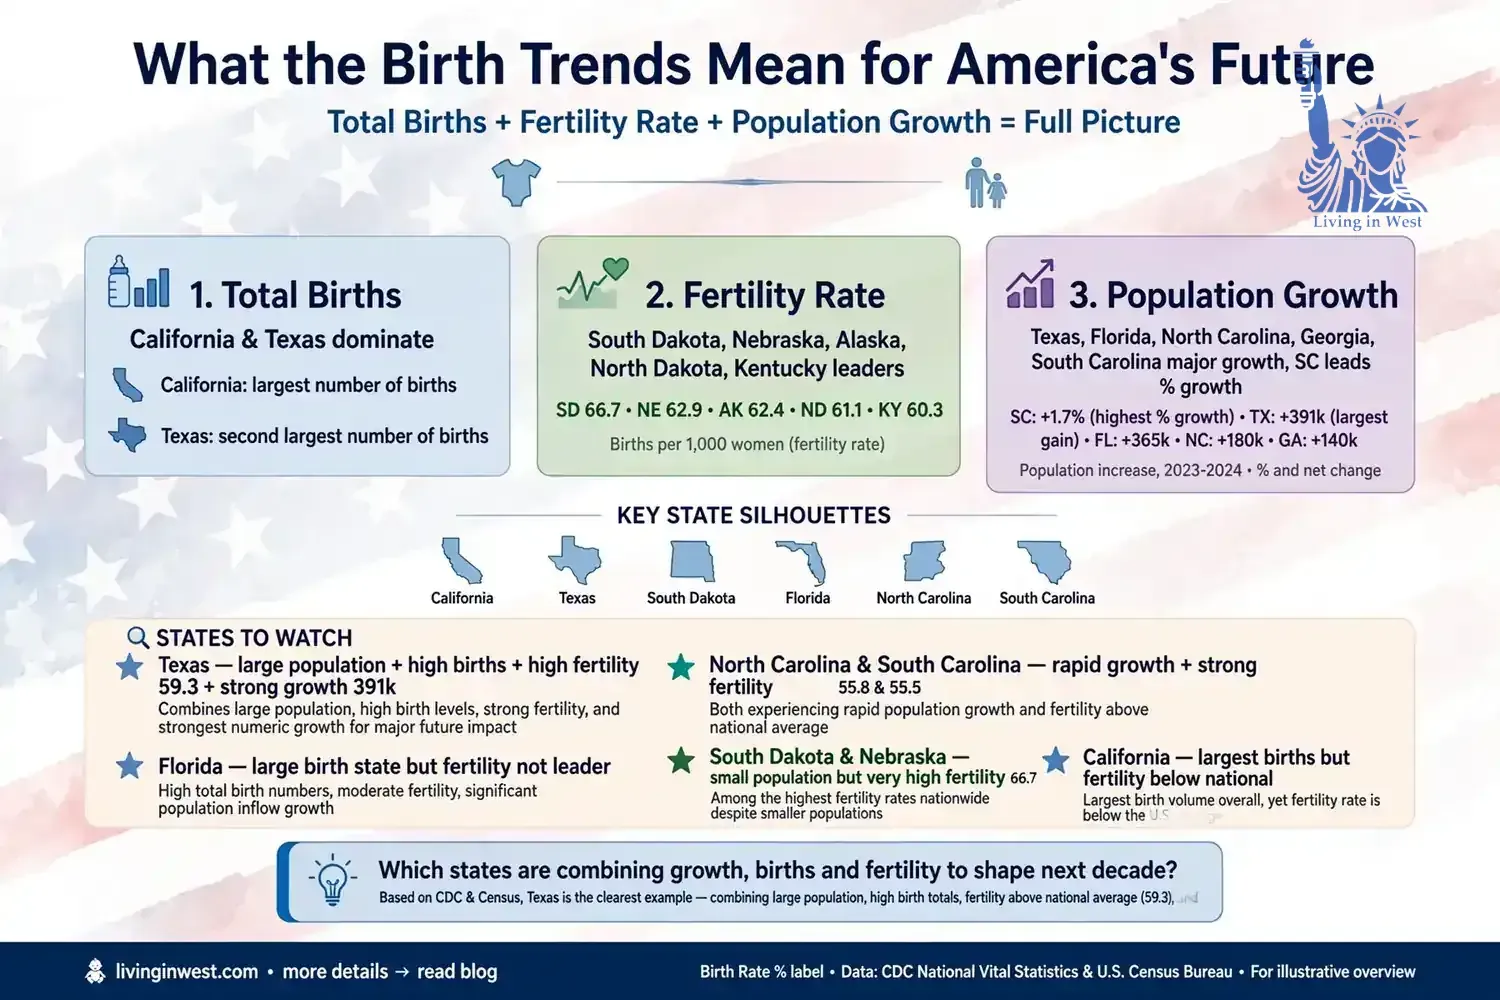
The most useful way to understand U.S. birth trends is to look at three measures together:
1. Total births
This shows where the largest numbers of babies are actually being born.
By this measure, California and Texas dominate.
2. Fertility rate
This measures births relative to the population of women ages 15–44.
By this measure, South Dakota, Nebraska, Alaska, North Dakota and Kentucky are among the leaders.
3. Population growth
This shows where the overall population is increasing.
By this measure, Texas, Florida, North Carolina, Georgia and South Carolina are among the major growth states, while South Carolina leads by percentage growth.
When these three measures are combined, the demographic picture becomes much clearer.
The states to watch
Texas stands out because it combines a very large population, high birth totals, relatively high fertility and strong population growth.
North Carolina and South Carolina stand out because of their rapid population growth and relatively strong fertility rates.
Florida remains one of the country's largest birth-producing states because of its enormous population, although its fertility rate is not among the national leaders.
California remains America's largest birth-producing state, even though its fertility rate is below the national rate.
South Dakota and Nebraska show the opposite pattern: comparatively small populations but very high fertility rates.
This distinction will become increasingly important over the next decade.
The U.S. population is aging, fertility remains below replacement level, and population growth increasingly depends on the interaction between births, deaths and migration.
For businesses, housing developers, schools, healthcare systems and local governments, these demographic shifts can influence where future demand appears.
The question is therefore no longer simply:
Which state has the most babies?
The more useful question is:
Which states are combining population growth, births and fertility in a way that could shape America's next decade?
Based on the latest available CDC and Census data, Texas is one of the clearest examples.
Frequently Asked Questions
Which U.S. state has the most births?
California had the most births in 2024, with 402,075, followed by Texas with 390,828.
Which state has the highest fertility rate?
South Dakota had the highest fertility rate among the 50 states in 2024, at 66.7 births per 1,000 women ages 15–44.
How many babies were born in the U.S. in 2024?
There were 3,628,934 births in the United States in 2024.
How many babies were born in the U.S. in 2025?
CDC's provisional figure is 3,606,400 births. That was approximately 1% below the 2024 total.
How many babies have been born in the U.S. in 2026?
A complete 2026 annual total is not available yet. 2026 is still an ongoing data year, so any full-year figure published before the year is complete should be clearly labeled as an estimate or projection rather than final CDC data.
Does California have the highest fertility rate?
No. California has the largest number of births, but its 2024 fertility rate was 49.8. South Dakota had the highest rate at 66.7.
Does Texas have a higher fertility rate than California?
Yes. Texas had a fertility rate of 59.3 in 2024, compared with 49.8 in California.
Which state is growing the fastest?
South Carolina had the fastest percentage population growth between 2024 and 2025, at about 1.5%. Texas had the largest numeric increase, adding approximately 391,243 residents.
Is the U.S. birth rate increasing?
Not consistently. Total births increased in 2024, but the general fertility rate declined. In 2025, both total births and the general fertility rate declined on a provisional basis.
What is the difference between birth count and fertility rate?
The birth count is the actual number of babies born to residents of a state. The general fertility rate measures live births per 1,000 women ages 15–44. A large state can therefore have many births without having a particularly high fertility rate.
Data Sources and Methodology
This article uses data from the U.S. Centers for Disease Control and Prevention (CDC), National Center for Health Statistics (NCHS) and the U.S. Census Bureau.
The state birth and fertility figures are based on CDC's final 2024 National Vital Statistics System data.
The national historical figures are based on finalized NCHS birth reports where available.
The 2025 national birth figure is explicitly labeled provisional because the CDC has not yet classified it as final.
The 2026 year is treated as an ongoing data year rather than a completed annual dataset.
CDC defines the general fertility rate as the number of live births per 1,000 women ages 15–44.
Population figures and population-growth comparisons use the Census Bureau's Vintage 2025 Population Estimates where specified.
Because birth counts and population estimates are updated on different schedules, the latest available year is not necessarily the same for every metric.
Official Sources
CDC — National Center for Health Statistics
CDC — State and Territorial Data
CDC State and Territorial Data
CDC — Stats of the States: Fertility Rate
U.S. Census Bureau — Population Estimates
U.S. Census Bureau Population Estimates
Editorial note
Birth statistics describe population patterns; they do not by themselves explain why people decide to have more or fewer children. Factors such as age structure, migration, economic conditions, family formation and access to healthcare can all influence demographic outcomes. Correlation between population growth and births should not automatically be interpreted as causation.

Editorial Team