
How Much Does the USA Import in 2026?
The latest U.S. Census Bureau and Bureau of Economic Analysis release covers July 2026, which was published on September 3, 2026.
In July, the United States imported approximately $320.6 billion of goods on a balance-of-payments basis, or $318.6 billion on a Census basis.
From January through July 2026, U.S. goods imports totaled approximately $2.10 trillion on a Census basis.
The United States also imports services. When goods and services are combined, July 2026 imports were approximately $399.3 billion, while exports were $310.7 billion. The resulting goods-and-services trade deficit was $88.6 billion.
For comparison, the United States imported approximately $3.30 trillion in goods during 2024, according to BEA data.
Top 10 U.S. Import Commodities in 2026
The ranking below uses the Census Bureau's detailed end-use commodity data and covers January through July 2026.
| Rank | Major Import Commodity | Jan–Jul 2026 Value |
|---|---|---|
| 1 | Computers | $220.79 billion |
| 2 | Pharmaceutical preparations | $100.28 billion |
| 3 | Passenger cars | $99.79 billion |
| 4 | Telecommunications equipment | $95.59 billion |
| 5 | Crude oil | $90.01 billion |
| 6 | Other automotive parts & accessories | $80.32 billion |
| 7 | Semiconductors | $75.04 billion |
| 8 | Cell phones & other household goods | $65.08 billion |
| 9 | Electric apparatus | $62.91 billion |
| 10 | Other industrial machinery | $51.22 billion |

1. Computers — $220.79 Billion
Computers were the largest individual commodity listed in the Census Bureau's January–July 2026 import data, at approximately $220.79 billion.
That figure covers computers classified within the Census Bureau's end-use system. It should not be confused with the much narrower HS-8471 figure from a particular tariff classification.
Why does the United States import so many computers?
Demand comes from:
- Data centers
- Artificial intelligence infrastructure
- Cloud computing
- Businesses
- Government agencies
- Universities
- Consumers
The U.S. technology industry also operates through global supply chains. A company can design hardware, develop software and operate cloud services in the United States while physical manufacturing takes place across several countries.
The economic value created in America therefore cannot be measured simply by looking at the customs value of the imported computer.

2. Pharmaceutical Preparations — $100.28 Billion
Pharmaceutical preparations were the second-largest individual commodity in the January–July 2026 data, with imports of approximately $100.28 billion.
Pharmaceutical products include medicines manufactured through highly internationalized supply chains.
The United States imports medicines and pharmaceutical products because production can involve different countries for:
- Research
- Active ingredients
- Manufacturing
- Packaging
- Distribution
- Specialized biologic production
Pharmaceutical imports were also a major contributor to the increase in U.S. consumer-goods imports in 2024. BEA reported that pharmaceutical preparations increased by $43.6 billion that year.
The value of pharmaceutical imports should not be interpreted as the total amount Americans spend on healthcare. Import values measure merchandise entering the country, not the full retail, insurance or healthcare-service cost

3. Passenger Cars — $99.79 Billion
Passenger cars ranked third among the individual commodities, with approximately $99.79 billion in imports during January–July 2026.
The U.S. automobile market is enormous, and American consumers buy vehicles manufactured in several countries.
Major international automotive supply chains connect the United States with:
- Mexico
- Canada
- Japan
- South Korea
- Germany
- Other manufacturing centers
The North American auto industry is particularly integrated.
A vehicle can contain components produced in multiple countries before reaching an American dealership.
The Census Bureau separately reported approximately $240.90 billion in imports of the broader automotive vehicles, parts and engines category through July 2026.
For readers interested in how tariffs and foreign automobile production are changing the U.S. market, see our related article: Chinese Cars in the USA 2026.

4. Telecommunications Equipment — $95.59 Billion
Telecommunications equipment ranked fourth, with approximately $95.59 billion in imports through July 2026.
These products support America's enormous communications and technology infrastructure.
They can be used in:
- Mobile networks
- Data communications
- Business networks
- Internet infrastructure
- Consumer electronics
- Telecommunications systems
The category also illustrates why modern trade statistics can look different depending on the classification system being used.
A smartphone, network component and other telecommunications products can fall into different detailed tariff classifications even when they are part of the same broader technology ecosystem.

5. Crude Oil — $90.01 Billion
The United States imported approximately $90.01 billion of crude oil during January–July 2026.
This may seem surprising because the United States is also one of the world's largest oil producers.
The explanation is that producing oil domestically does not eliminate the need for imports.
U.S. refineries process different grades of crude, and imported crude can fit the requirements of particular refineries and regional supply chains.
Through July 2026, crude-oil imports were approximately $90 billion, while U.S. crude-oil exports were approximately $84.77 billion.
Crude oil is also an industrial input.
It can be processed into:
- Gasoline
- Diesel
- Jet fuel
- Petrochemical feedstocks
- Lubricants
- Other petroleum products
That means crude-oil trade should be viewed as part of a larger energy and refining system rather than simply as a consumer purchase.

6. Other Automotive Parts & Accessories — $80.32 Billion
The United States imported approximately $80.32 billion of other automotive parts and accessories during January–July 2026.
This reflects how deeply integrated modern automobile manufacturing has become.
Parts can cross borders several times before a finished vehicle reaches the customer.
For example:
A component can be manufactured in Mexico → shipped to a U.S. factory → installed into a vehicle → sold to an American customer.
This is one reason automobile trade cannot always be divided neatly into "American" and "foreign" products.
The Census Bureau recorded total automotive vehicles, parts and engines imports of approximately $240.90 billion through July 2026.

7. Semiconductors — $75.04 Billion
Semiconductors ranked seventh among the individual import commodities, with approximately $75.04 billion in imports through July 2026.
Chips are essential for:
- Artificial intelligence
- Smartphones
- Cars
- Computers
- Data centers
- Medical equipment
- Industrial machinery
- Consumer electronics
The semiconductor industry is highly specialized.
One country may design a chip, another may manufacture wafers, another may package or test the chip, and another may assemble the final electronic product.
That international specialization is one reason semiconductor trade is so important to the U.S. technology sector.
The Census Bureau also reported that semiconductor imports reached approximately $13.05 billion in July 2026 alone, bringing the January–July total to $75.04 billion.
8. Cell Phones & Other Household Goods — $65.08 Billion
The Census Bureau recorded approximately $65.08 billion in imports of cell phones and other household goods during January–July 2026.
This category shows the enormous scale of American consumer demand for electronics.
Smartphones require international supply chains involving:
- Chips
- Displays
- Batteries
- Cameras
- Memory
- Processors
- Assembly
- Software
The final retail price of a phone is therefore not the same as its import value.
After a phone enters the United States, the final price can also include transportation, distribution, retail costs, marketing, tariffs where applicable, operating expenses and business margins.
This is why a $1,000 retail smartphone cannot simply be treated as a $1,000 import or a $1,000 profit for an American company.
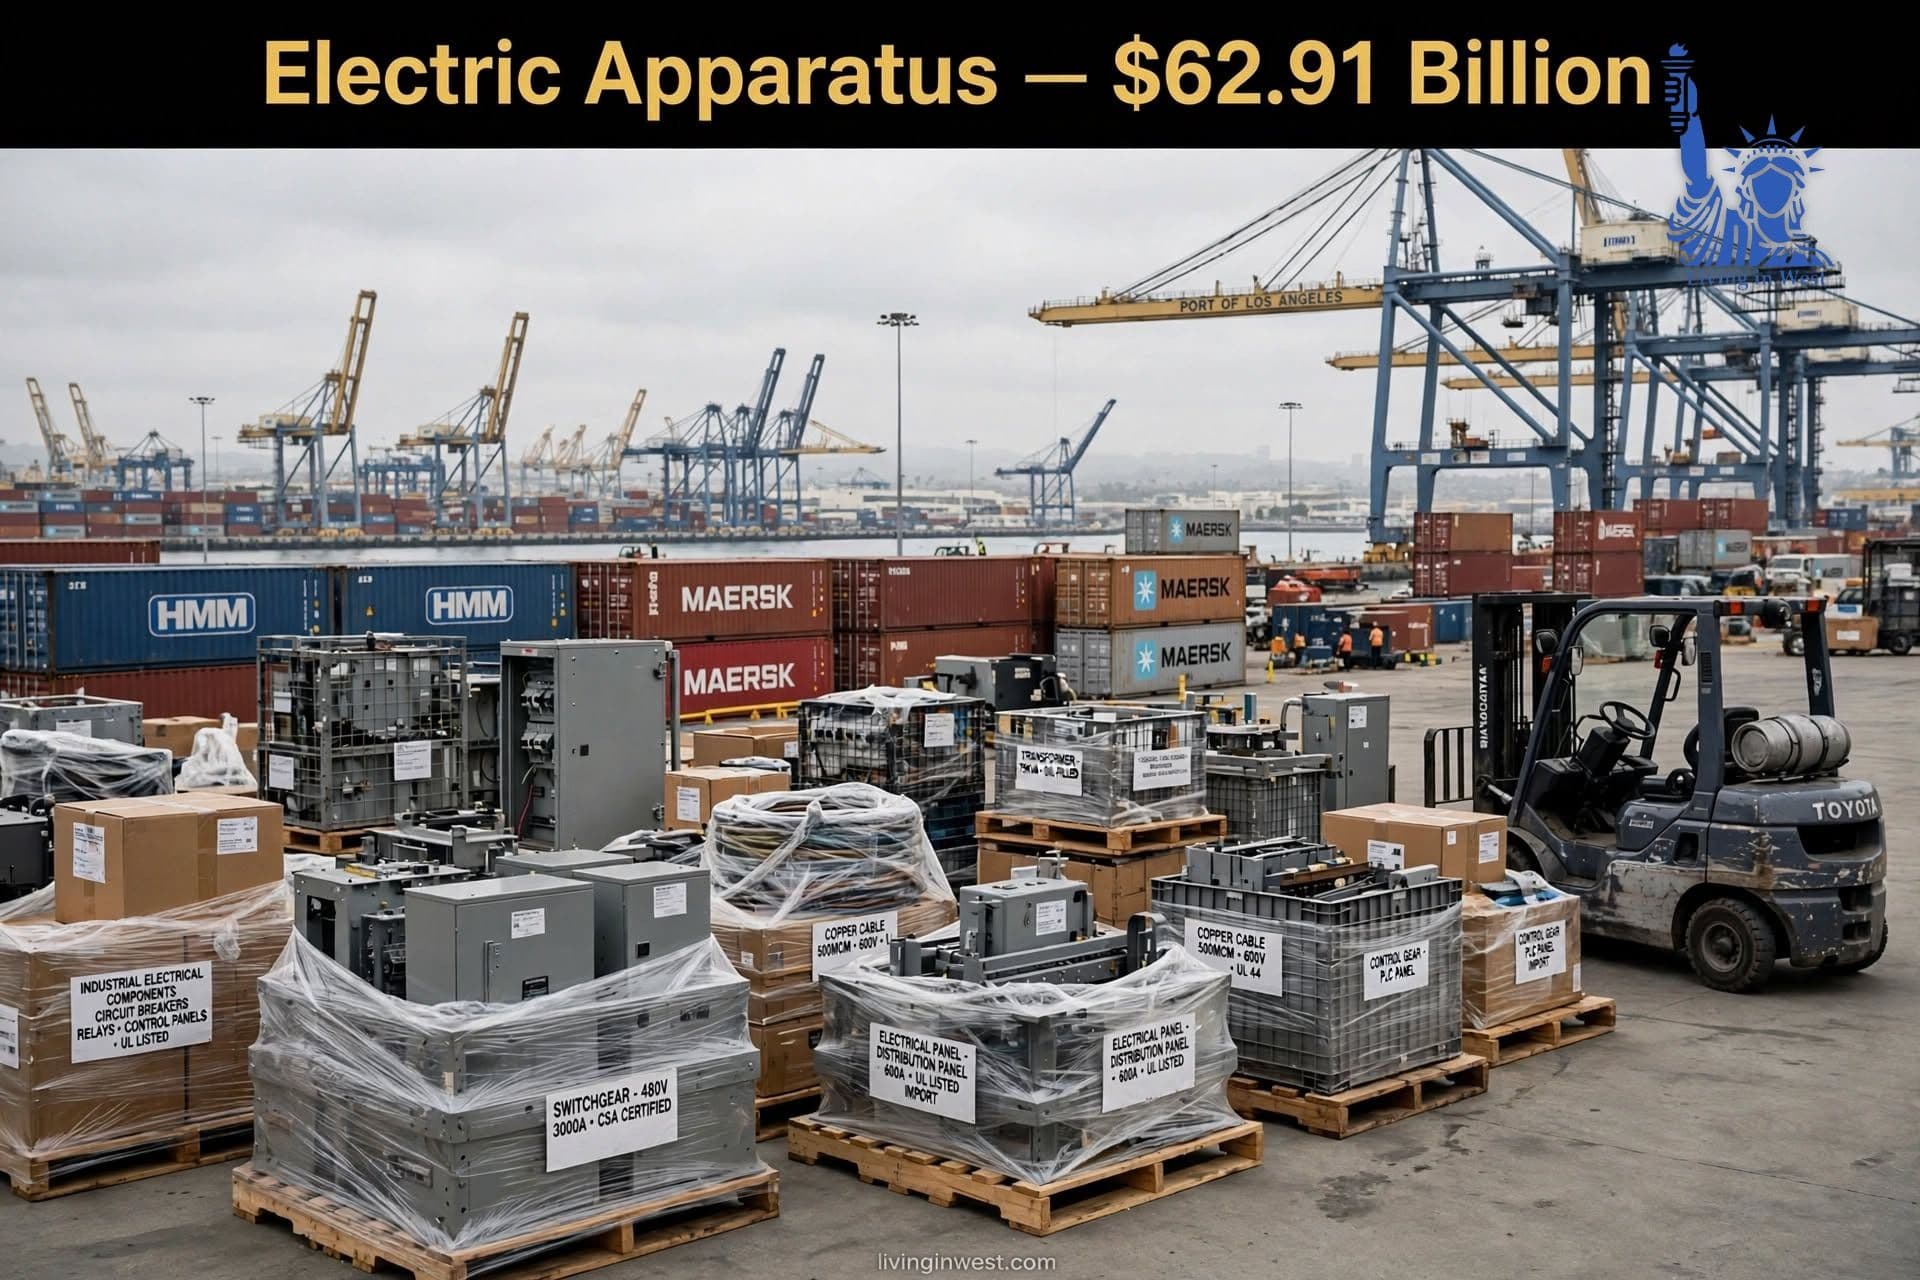
9. Electric Apparatus — $62.91 Billion
Electric apparatus imports reached approximately $62.91 billion through July 2026.
These products support many parts of the economy, including:
- Electrical systems
- Industrial equipment
- Buildings
- Manufacturing
- Electronics
- Energy infrastructure
- Consumer products
As factories modernize and businesses invest in technology, demand for electrical equipment can increase.
Some imported electrical products are sold to consumers, while others become components or equipment used by American companies.

10. Other Industrial Machinery — $51.22 Billion
Other industrial machinery accounted for approximately $51.22 billion in U.S. imports through July 2026.
American manufacturers use imported machinery for:
- Production
- Automation
- Factory upgrades
- Construction
- Materials handling
- Processing
- Industrial operations
An imported machine does not necessarily remain a finished consumer product.
A factory may purchase a machine from overseas and use it for many years to produce goods in the United States.
That means the economic value of the machine can extend far beyond the initial import transaction.
The wider Census Bureau capital-goods category — which includes computers, computer accessories, telecommunications equipment and machinery — reached approximately $870.01 billion in imports during January–July 2026.
Where Do America's Imports Come From?
The United States buys products from almost every major manufacturing region in the world.
The latest July 2026 Census data show particularly large U.S. goods-trade deficits with several major trading partners.
In July 2026, the U.S. goods trade deficit was approximately:
Mexico: $27.5 billion
Vietnam: $23.3 billion
Taiwan: $18.1 billion
China: $15.2 billion
South Korea: $10.4 billion
European Union: $8.9 billion
Germany: $5.6 billion
India: $5.0 billion
Malaysia: $4.8 billion
Japan: $4.2 billion
Canada: $3.2 billion
These figures are trade balances, not simply import totals. For example, the United States imported approximately $60.1 billion from Mexico in July 2026 and exported approximately $32.6 billion to Mexico.
Canada was different in scale: July U.S. imports from Canada were approximately $32.5 billion, while exports to Canada were approximately $29.3 billion.
This distinction matters because a country's trade deficit with the United States is not the same thing as the total value of U.S. imports from that country.
Why Does the USA Import So Much?
There is no single reason.
The United States imports because of a combination of:
Consumer demand
Americans purchase large quantities of cars, phones, clothing, electronics and household products.
Global manufacturing
Different countries specialize in different products and production stages.
Natural resources
The U.S. imports certain raw materials and energy products even though it produces many resources domestically.
Business investment
American factories import machinery, computers, chips and other equipment.
Supply-chain efficiency
Companies often manufacture components where the required skills, suppliers or production capacity are available.
International specialization
Modern products frequently cross borders several times before becoming a finished product.
5 Common Myths About U.S. Imports
Myth 1: A trade deficit means America is losing the same amount of money
A trade deficit means the value of imports exceeds the value of exports for the measured category and period.
It does not mean that every imported product creates an equivalent economic loss.
In 2024, the U.S. goods deficit was approximately $1.21 trillion, while the country recorded a services surplus of approximately $293.3 billion. The combined goods-and-services deficit was approximately $918.4 billion.
Myth 2: Every imported product is resold for a huge profit
Import value and retail price are different measurements.
Between the factory and the consumer there can be shipping, insurance, tariffs, warehousing, marketing, employee costs, rent, financing, distribution and retail expenses.
The final selling price therefore cannot be treated as pure profit.
Myth 3: If America produces oil, it should not import oil
The United States produces large amounts of crude oil but also imports crude that can fit particular refinery configurations and regional supply chains.
At the same time, America exports crude oil and refined petroleum products.
Myth 4: A phone made overseas creates no U.S. economic value
A physical device can be manufactured overseas while American companies generate value through:
- Product development
- Software
- Cloud services
- Advertising
- Distribution
- Retail
- Intellectual property
- Customer services
The import statistic measures the value assigned to the merchandise entering the country, not all subsequent economic activity.
Myth 5: Imports are only consumer products
A large portion of U.S. imports consists of business inputs and capital equipment.
In January–July 2026, the Census Bureau recorded approximately $870.0 billion in capital-goods imports, including computers, computer accessories, semiconductors, telecommunications equipment and industrial machinery.
How U.S. Imports Affect Prices You Pay
Imports can have a direct connection to everyday prices.
When an imported product or component becomes more expensive, American companies may face higher costs.
Tariffs can also increase the cost of imported goods or imported components, although the final effect depends on the product, supplier, importer, retailer and market conditions.
For consumers, the impact can show up in areas such as:
Electronics
Higher costs for imported components can affect phones, computers and other devices.
Cars
Vehicles contain large numbers of imported components, so tariffs or supply-chain disruptions can affect production costs.
Household products
Furniture, appliances, clothing and other consumer goods are frequently sourced internationally.
Gasoline
Crude-oil prices influence refinery costs and can affect gasoline and other petroleum-product prices.
This does not mean every tariff or import-cost increase automatically reaches consumers in full. Businesses can absorb some costs, change suppliers, reduce margins or adjust prices depending on market conditions.
What About the U.S. Trade Deficit in 2026?
The latest July 2026 data show a significant U.S. goods deficit.
In July:
Goods imports: $320.6 billion
Goods exports: $201.0 billion
Goods deficit: $119.6 billion
When services are included:
Total imports: $399.3 billion
Total exports: $310.7 billion
Goods-and-services deficit: $88.6 billion
The difference between the two deficit figures exists because the United States runs a substantial services surplus. In July 2026, the services surplus was approximately $31.0 billion.
Through July 2026, the U.S. goods deficit was approximately $661.8 billion on a balance-of-payments basis.
For comparison, the full-year 2024 goods deficit was approximately $1.21 trillion, while the goods-and-services deficit was approximately $918.4 billion.
U.S. Imports vs. U.S. Exports
Imports and exports are two sides of the same international trading system.
The United States imports:
- Computers
- Cars
- Medicines
- Oil
- Machinery
- Electronics
- Automotive parts
- Semiconductors
At the same time, America exports:
- Petroleum
- Natural gas
- Pharmaceuticals
- Aircraft
- Computers
- Machinery
- Agricultural products
- Chemicals
- Medical equipment
For a detailed look at America's export economy, read our related guide: USA Export 5-Year Growth: Top Products & Export Data.
The two articles together provide a clearer picture than looking at imports or exports alone.
How Trade Connects With America's Debt and Economy
Trade is only one part of the U.S. economy.
The trade deficit should not be confused with the federal budget deficit or national debt.
The trade deficit measures the difference between exports and imports.
The federal budget deficit measures the difference between federal government spending and revenue.
The national debt is the accumulated federal debt.
These are different economic measurements.
For more background on the U.S. national debt and federal borrowing, see our related guide: U.S. National Debt in 2026.
Why the Import Ranking Can Change
Import rankings are not permanent.
Monthly trade data can change because of:
- Consumer demand
- Oil prices
- Vehicle shipments
- Semiconductor demand
- Tariffs
- Inventory changes
- Seasonal patterns
- Supply-chain disruptions
- Currency movements
- Business investment
The Census Bureau also revises previous monthly figures when more complete information becomes available.
The July 2026 release, for example, revised January through June 2026 data.
That is why a "Top 10 Imports 2026" article should always specify the exact period being measured.
Final Takeaway
The United States is importing far more than finished consumer products.
The latest January–July 2026 data show enormous demand for computers, medicines, passenger cars, telecommunications equipment, crude oil, automotive parts, semiconductors, phones, electrical equipment and industrial machinery.
Computers alone accounted for approximately $220.8 billion in imports during the first seven months of 2026, while the broader capital-goods category reached approximately $870 billion.
These imports serve different purposes.
Some go directly to consumers.
Some become inputs for American factories.
Some support hospitals and healthcare.
Some power data centers and technology companies.
Others become part of products manufactured and sold in the United States.
The U.S. trade deficit is therefore best understood as a measure of the country's international goods-and-services transactions, not as a simple calculation of how much money America "loses" on every imported product.
FAQ
What is the biggest U.S. import in 2026?
Based on the Census Bureau's detailed end-use commodity data for January–July 2026, computers were the largest individual commodity listed, with approximately $220.79 billion in imports.
How much did the USA import in 2026?
Through July 2026, U.S. goods imports totaled approximately $2.10 trillion on a Census basis.
What are America's top imports in 2026?
Major individual commodities include computers, pharmaceutical preparations, passenger cars, telecommunications equipment, crude oil, automotive parts, semiconductors, cell phones and household goods, electric apparatus and industrial machinery.
Which country sends the most imports to the USA?
The answer depends on whether the comparison uses total imports, country of origin, a particular month or another trade measure. In July 2026, Mexico had U.S. imports of approximately $60.1 billion, while Canada had approximately $32.5 billion.
Why does America import oil if it produces oil?
U.S. refineries process different crude-oil grades, so imported crude can be economically useful even while domestic oil production remains very large.
Does the U.S. trade deficit mean America is losing money?
No. A trade deficit means imports exceed exports for the specified measurement and period. It does not measure the profitability of individual imports or companies.
Do tariffs make imported products more expensive?
Tariffs can increase the cost of imported goods or components, but the final effect depends on businesses, suppliers, retailers, market competition and whether companies absorb or pass through some of the additional cost.
Are U.S. imports mostly consumer products?
No. Business and capital goods make up a very large share of U.S. imports. Capital-goods imports were approximately $870.0 billion through July 2026.
Data Sources
The primary source for the 2026 import ranking is the U.S. Census Bureau's July 2026 International Trade in Goods and Services report, particularly Exhibit 8, "U.S. Imports of Goods by End-Use Category and Commodity."
The broader annual trade figures and goods-versus-services comparison use the U.S. Bureau of Economic Analysis.
The Census Bureau's FT900 historical releases provide the monthly 2026 reports and supporting spreadsheets for users who want to examine the underlying data.
U.S. Census Bureau: International Trade Data & FT900
U.S. Bureau of Economic Analysis: International Trade in Goods and Services
U.S. International Trade Commission DataWeb: USITC DataWeb
Disclaimer
Trade statistics can be revised by U.S. government agencies as additional information becomes available.
This article uses U.S. Census Bureau and BEA data available through the July 2026 trade release. Import rankings can change depending on the classification system, period and methodology used.
Individual HS codes should not be added to broad end-use categories without checking for overlap, because doing so can produce double-counting.
This article is for general informational and educational purposes and should not be treated as financial, investment or business advice.

Editorial Team