What Does the United States Export?
When people think about American exports, they often think about soybeans, corn, wheat and oil. These are important, but they represent only part of America's export economy.
The United States exports a much wider range of products, including computers, semiconductors, aircraft, aircraft engines, medical equipment, automobiles, pharmaceuticals, petroleum products, natural gas, metals, chemicals, food and agricultural commodities.
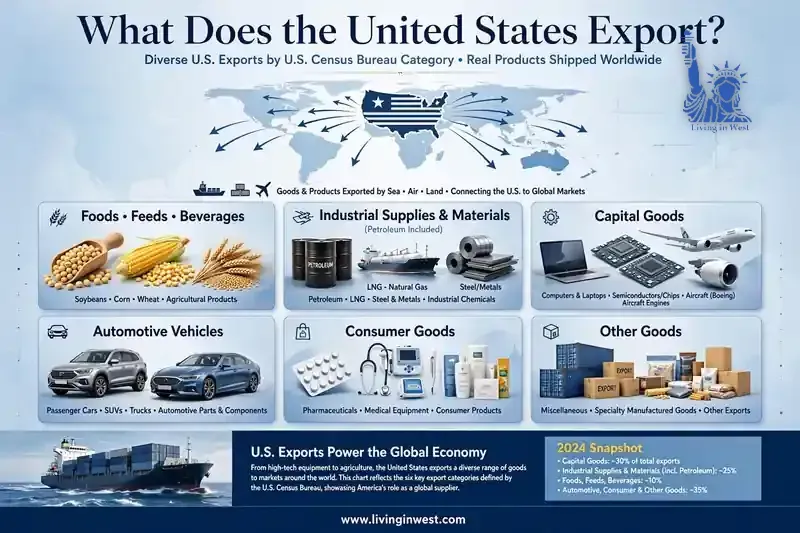
The U.S. Census Bureau divides merchandise exports into major end-use categories such as foods, feeds and beverages; industrial supplies and materials; capital goods; automotive vehicles; consumer goods; and other goods. Petroleum and petroleum products are included within the industrial-supplies category.
For this five-year comparison, all total figures below use the Census Bureau's Census-basis goods-export data, so the years can be compared consistently.
PART 1 — U.S. Exports in 2021
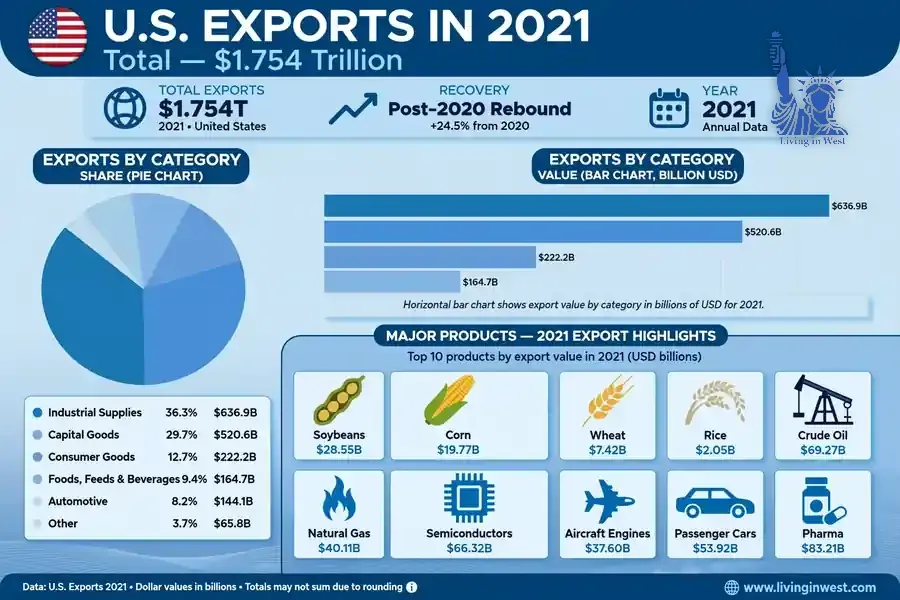
Total U.S. Goods Exports: $1.754 Trillion
In 2021, the United States exported approximately $1.754 trillion worth of goods.
The largest broad export category was industrial supplies and materials, followed by capital goods. America also exported large amounts of food and agricultural products, automobiles and consumer goods.
2021 Export Categories
- Total Goods Exports: $1,754.3B
- Industrial Supplies & Materials: $636.9B
- Capital Goods: $520.6B
- Consumer Goods: $222.2B
- Foods, Feeds & Beverages: $164.7B
- Automotive Vehicles, Parts & Engines: $144.1B
- Other Goods: $65.8B
Major Products Exported in 2021
Agriculture & Food
- Soybeans: $28.55B
- Corn: $19.77B
- Wheat: $7.42B
- Rice: $2.05B
- Meat, poultry and related products: $25.06B
- Animal feeds: $10.91B
- Nuts: $9.63B
- Vegetables: $7.19B
- Dairy products and eggs: $6.51B
- Fish and shellfish: $5.43B
Energy & Industrial Materials
- Crude oil: $69.27B
- Other petroleum products: $64.19B
- Fuel oil: $32.02B
- Natural gas: $40.11B
- Nonmonetary gold: $30.95B
- Plastic materials: $44.10B
- Organic chemicals: $33.99B
- Finished metal shapes: $22.16B
- Cotton: $5.70B
Technology, Machinery & Aerospace
- Semiconductors: $66.32B
- Other industrial machinery: $68.45B
- Electric apparatus: $42.88B
- Civilian aircraft engines: $37.60B
- Medical equipment: $39.85B
- Computer accessories: $29.11B
- Telecommunications equipment: $32.60B
- Civilian aircraft: $24.25B
Automotive
- Passenger cars: $53.92B
- Other automotive parts and accessories: $47.36B
- Trucks, buses and special-purpose vehicles: $21.14B
- Engines and engine parts: $18.55B
Consumer Products
- Pharmaceutical preparations: $83.21B
- Gem diamonds: $16.70B
- Cell phones and household goods: $30.29B
- Jewelry: $9.25B
- Toiletries and cosmetics: $13.27B
- Toys, games and sporting goods: $10.90B
These figures show that even in 2021, American exports were already heavily diversified rather than being dependent on agriculture alone.
PART 2 — U.S. Exports in 2022
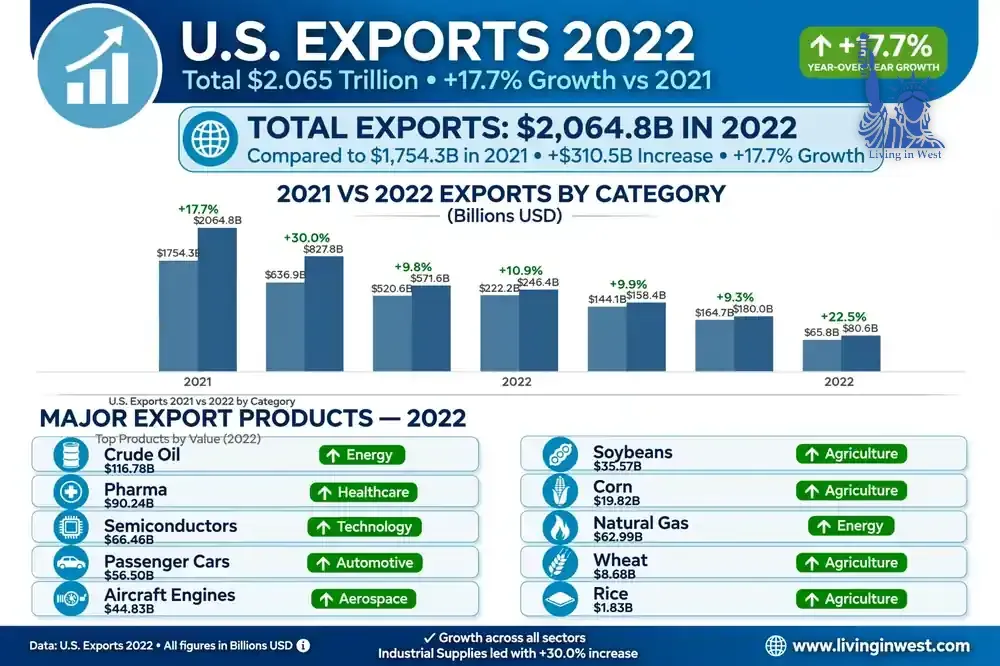
Total U.S. Goods Exports: $2.065 Trillion
2022 was the biggest percentage-growth year in this five-year period.
U.S. goods exports increased from $1.754T in 2021 to $2.065T in 2022, an increase of approximately 17.7%.
The major reason was the sharp rise in the value of industrial supplies and materials, including energy and petroleum products.
2021 → 2022 Comparison
- Total Goods: $1,754.3B → $2,064.8B = +17.7%
- Industrial Supplies: $636.9B → $827.8B = +30.0%
- Capital Goods: $520.6B → $571.6B = +9.8%
- Consumer Goods: $222.2B → $246.4B = +10.9%
- Automotive: $144.1B → $158.4B = +9.9%
- Food, Feeds & Beverages: $164.7B → $180.0B = +9.3%
- Other Goods: $65.8B → $80.6B = +22.5%
Major 2022 Export Products
Agriculture & Food
- Soybeans: $35.57B
- Corn: $19.82B
- Wheat: $8.68B
- Rice: $1.83B
- Meat, poultry, etc.: $26.51B
- Animal feeds: $12.42B
- Nuts: $9.68B
- Vegetables: $7.47B
- Dairy & eggs: $7.93B
- Fish & shellfish: $5.62B
Energy
- Crude oil: $116.78B
- Other petroleum products: $91.02B
- Fuel oil: $60.14B
- Natural gas: $62.99B
- Natural gas liquids: $37.71B
- Nonmonetary gold: $40.08B
Industrial Materials
- Plastic materials: $50.30B
- Organic chemicals: $39.86B
- Other chemicals: $41.93B
- Finished metal shapes: $25.22B
- Cotton, raw: $9.05B
- Metallurgical-grade coal: $13.34B
Technology & Capital Goods
- Semiconductors: $66.46B
- Other industrial machinery: $73.91B
- Electric apparatus: $49.07B
- Civilian aircraft engines: $44.83B
- Medical equipment: $42.86B
- Computer accessories: $31.52B
- Telecommunications equipment: $34.61B
- Civilian aircraft: $28.98B
Automotive
- Passenger cars: $56.50B
- Other automotive parts: $54.39B
- Trucks, buses and special-purpose vehicles: $24.17B
- Engines and engine parts: $19.99B
Consumer Goods
- Pharmaceuticals: $90.24B
- Gem diamonds: $20.72B
- Cell phones and household goods: $31.80B
- Jewelry: $11.89B
- Toiletries and cosmetics: $14.28B
- Toys, games and sporting goods: $12.30B
Why Was 2022 So Strong?
The biggest story was energy and industrial materials.
Industrial-supplies exports jumped about 30%, with crude oil, petroleum products, natural gas and other materials contributing heavily to the increase.
So 2022 was not simply an agricultural-export boom. It was a broad increase in the dollar value of U.S. merchandise exports.
PART 3 — U.S. Exports in 2023
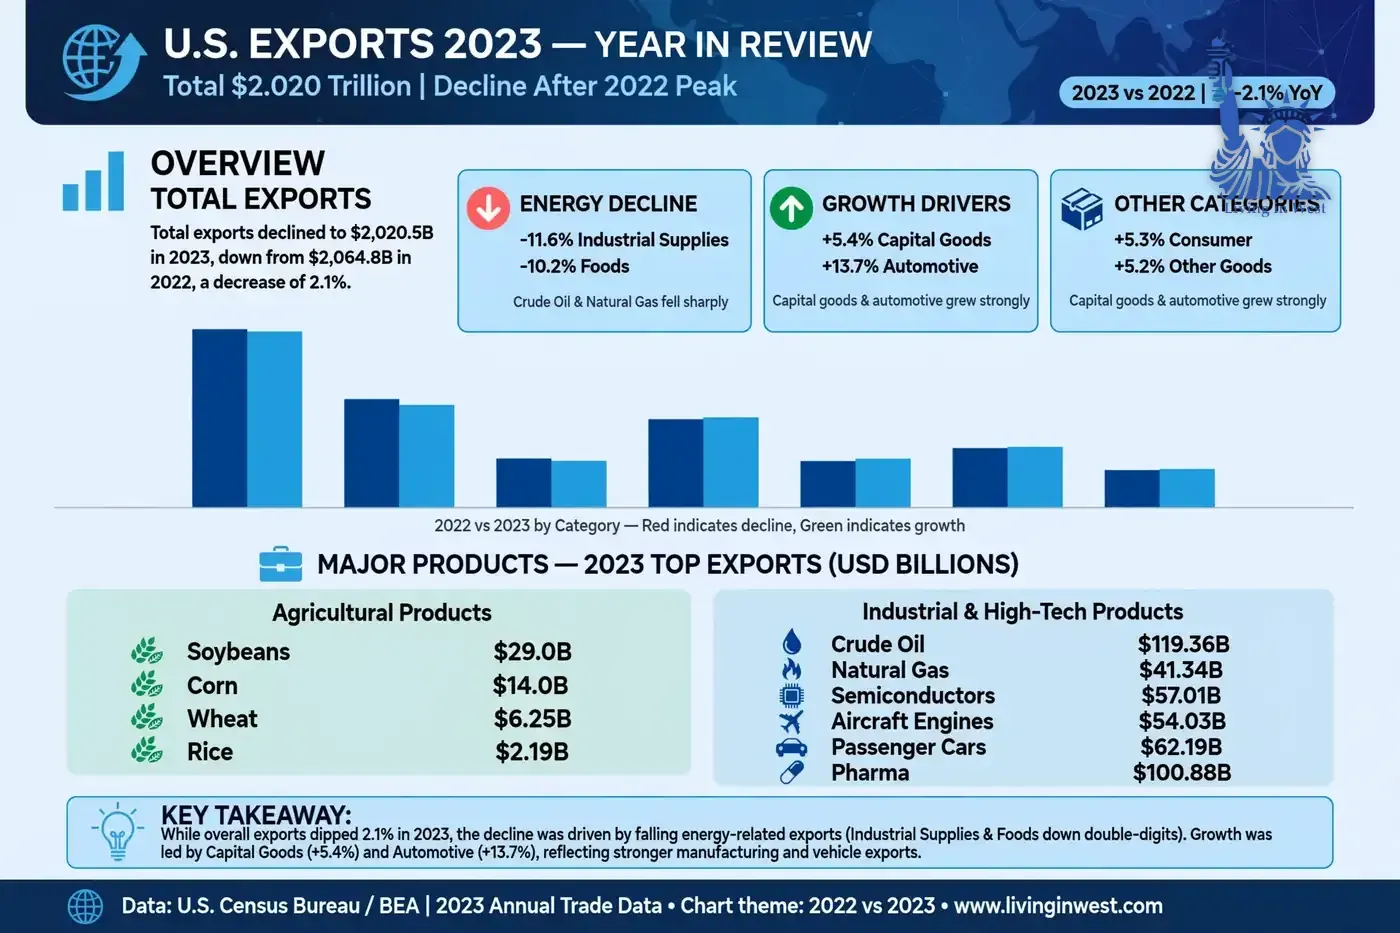
Total U.S. Goods Exports: $2.020 Trillion
After the huge increase in 2022, U.S. goods exports declined in 2023.
Exports fell from $2.065T to $2.020T, a decline of approximately 2.1%.
2022 → 2023 Comparison
- Total Goods: $2,064.8B → $2,020.5B = −2.1%
- Industrial Supplies: $827.8B → $732.1B = −11.6%
- Food, Feeds & Beverages: $180.0B → $161.7B = −10.2%
- Capital Goods: $571.6B → $602.4B = +5.4%
- Automotive: $158.4B → $180.0B = +13.7%
- Consumer Goods: $246.4B → $259.4B = +5.3%
- Other Goods: $80.6B → $84.8B = +5.2%
Major 2023 Export Products
Agriculture & Food
- Soybeans: about $29B
- Corn: about $14B
- Wheat: about $6.25B
- Rice: about $2.19B
- Meat, poultry and related products: about $24–25B
- Nuts: about $9.7B
- Animal feeds: about $12.5B
- Dairy and eggs: about $6.6B
Energy & Industrial Materials
- Crude oil: about $119.36B
- Other petroleum products: about $79.64B
- Fuel oil: about $48.29B
- Natural gas: about $41.34B
- Nonmonetary gold: about $29.32B
- Natural gas liquids: about $31.27B
- Plastic materials: about $44.76B
- Organic chemicals: about $39.47B
Capital Goods & Technology
- Semiconductors: $57.01B
- Civilian aircraft engines: $54.03B
- Computer accessories: $29.14B
- Computers: $19.83B
- Electric apparatus: $53.37B
- Other industrial machinery: $68.90B
- Medical equipment: $46.40B
- Telecommunications equipment: $39.20B
Automotive
- Passenger cars: $62.19B
- Other automotive parts: $63.08B
- Trucks, buses and special-purpose vehicles: $29.96B
- Engines and engine parts: $21.36B
Consumer Goods
- Pharmaceuticals: $100.88B
- Gem diamonds: $20.72B
- Cell phones and household goods: $33.17B
- Jewelry: $14.46B
- Toiletries and cosmetics: $15.04B
- Toys, games and sporting goods: $10.87B
The key point in 2023 was that energy and industrial-supply exports fell sharply, while capital goods and automotive exports continued to grow.
PART 4 — U.S. Exports in 2024
Total U.S. Goods Exports: $2.062 Trillion
2024 brought the U.S. export economy back into growth.
Goods exports increased from $2.020T in 2023 to $2.062T in 2024, an increase of about 2.0%.
2023 → 2024 Comparison
- Total Goods: $2,020.5B → $2,061.7B = +2.0%
- Food, Feeds & Beverages: $161.7B → $165.8B = +2.5%
- Industrial Supplies: $732.1B → $727.9B = −0.6%
- Capital Goods: $602.4B → $646.4B = +7.3%
- Automotive: $180.0B → $172.2B = −4.3%
- Consumer Goods: $259.4B → $260.1B = +0.3%
- Other Goods: $84.8B → $89.3B = +5.4%
Major 2024 Export Products
Agriculture & Food
- Soybeans: $25.79B
- Corn: $14.85B
- Wheat: $6.02B
- Rice: $2.62B
- Meat, poultry, etc.: $26.01B
- Nuts: $10.80B
- Animal feeds: $11.72B
- Vegetables: $8.67B
- Dairy & eggs: $6.78B
- Fish & shellfish: $5.06B
Energy & Industrial Materials
- Crude oil: $118.52B
- Other petroleum products: $77.38B
- Fuel oil: $49.69B
- Natural gas: $34.29B
- Natural gas liquids: $34.82B
- Nonmonetary gold: $34.22B
- Plastic materials: $45.87B
- Organic chemicals: $31.46B
Technology & Capital Goods
- Other industrial machinery: $71.11B
- Civilian aircraft engines: $63.14B
- Semiconductors: $64.95B
- Electric apparatus: $57.02B
- Telecommunications equipment: $41.21B
- Computer accessories: $40.43B
- Medical equipment: $46.01B
- Civilian aircraft: $33.72B
Automotive
- Passenger cars: $59.41B
- Other automotive parts: $59.41B
- Trucks, buses and special-purpose vehicles: $27.80B
- Engines and engine parts: $22.20B
Consumer Goods
- Pharmaceutical preparations: $107.61B
- Cell phones and household goods: $33.54B
- Gem diamonds: $16.01B
- Jewelry: $13.63B
- Toiletries and cosmetics: $15.48B
- Toys, games and sporting goods: $10.79B
What Changed in 2024?
The biggest positive story was capital goods.
Capital-goods exports increased by roughly $44 billion, with strong growth in computer accessories, civilian aircraft engines, computers and semiconductors. At the same time, automotive exports declined.
PART 5 — U.S. Exports in 2025
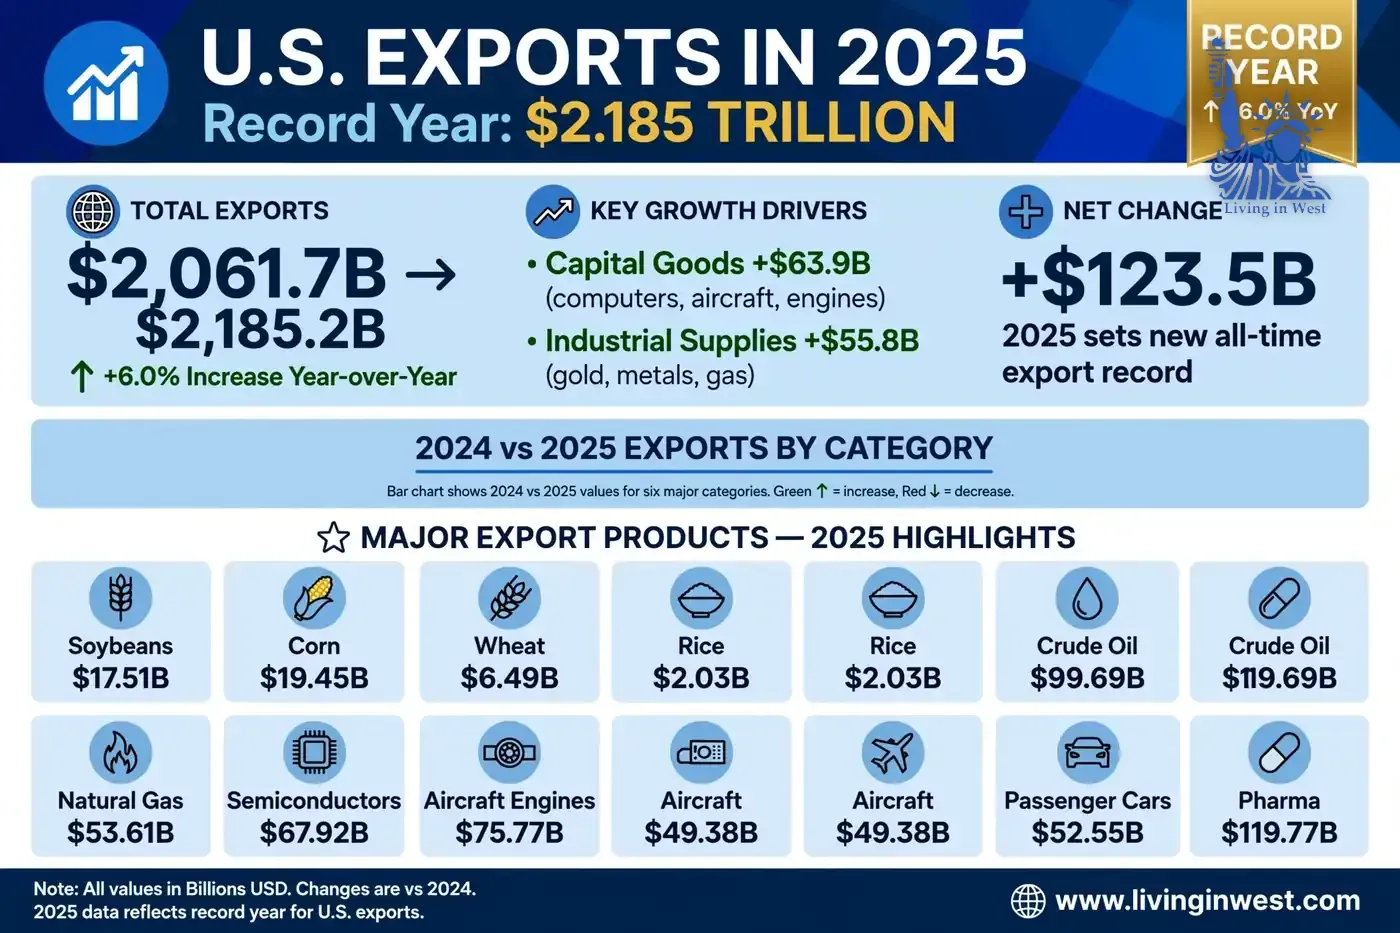
Record Year: $2.185 Trillion
2025 became the highest year in this five-year period for U.S. goods exports.
U.S. goods exports increased from $2.062T in 2024 to approximately $2.185T in 2025, an increase of about 6.0%.
2024 → 2025 Comparison
- Total Goods: $2,061.7B → $2,185.2B = +6.0%
- Food, Feeds & Beverages: $165.8B → $161.0B = −2.9%
- Industrial Supplies: $727.9B → $783.7B = +7.7%
- Capital Goods: $646.4B → $710.3B = +9.9%
- Automotive: $172.2B → $155.4B = −9.8%
- Consumer Goods: $260.1B → $269.2B = +3.5%
- Other Goods: $89.3B → $105.8B = +18.4%
Major 2025 Export Products
Agriculture & Food
- Soybeans: $17.51B
- Corn: $19.45B
- Wheat: $6.49B
- Rice: $2.03B
- Meat, poultry, etc.: $25.10B
- Nuts: $11.94B
- Animal feeds: $11.33B
- Fruits and frozen juices: $9.26B
- Dairy products and eggs: $7.84B
- Vegetables: $7.61B
The USDA's agricultural dataset gives different commodity totals because it uses its own agricultural-trade classification. For example, USDA reports 2025 corn exports at $18.55B and soybeans at about $16.2B. Therefore, the Census and USDA numbers should not be mixed in the same comparison table without explaining the methodology.
Energy & Industrial Materials
- Nonmonetary gold: $83.90B
- Crude oil: $99.69B
- Other petroleum products: $73.82B
- Natural gas: $53.61B
- Fuel oil: $45.02B
- Finished metal shapes: $46.41B
- Natural gas liquids: $35.79B
- Plastic materials: $43.68B
- Other chemicals: $38.94B
- Precious metals, other: $20.63B
Technology, Machinery & Aerospace
- Civilian aircraft engines: $75.77B
- Semiconductors: $67.92B
- Electric apparatus: $56.85B
- Computer accessories: $56.04B
- Civilian aircraft: $49.38B
- Telecommunications equipment: $46.56B
- Computers: $44.83B
- Medical equipment: $45.90B
- Other industrial machinery: $69.99B
Automotive
- Passenger cars: $52.55B
- Other automotive parts: $57.02B
- Trucks, buses and special-purpose vehicles: $21.95B
- Engines and engine parts: $20.85B
Automotive exports were one of the major areas that declined in 2025. Total automotive vehicles, parts and engines fell to approximately $155.4B, down about $16.8B from 2024.
Consumer Goods
- Pharmaceutical preparations: $119.77B
- Cell phones and household goods: $37.33B
- Jewelry: $14.52B
- Toiletries and cosmetics: $14.95B
- Gem diamonds: $11.13B
- Toys, games and sporting goods: $10.87B
- Other consumer nondurables: $7.16B
- Household appliances: $6.83B
Why Did U.S. Exports Reach a Record in 2025?
The record was driven mainly by capital goods and industrial supplies, rather than agricultural exports.
Capital-goods exports increased by approximately $63.9B, including major increases in:
- Computers
- Civilian aircraft
- Computer accessories
- Civilian aircraft engines
Industrial supplies increased by about $55.8B, with particularly large increases in nonmonetary gold, finished metal shapes and natural gas.
At the same time, automotive exports dropped by about $16.8B.
5-Year U.S. Export Growth: 2021 vs. 2025
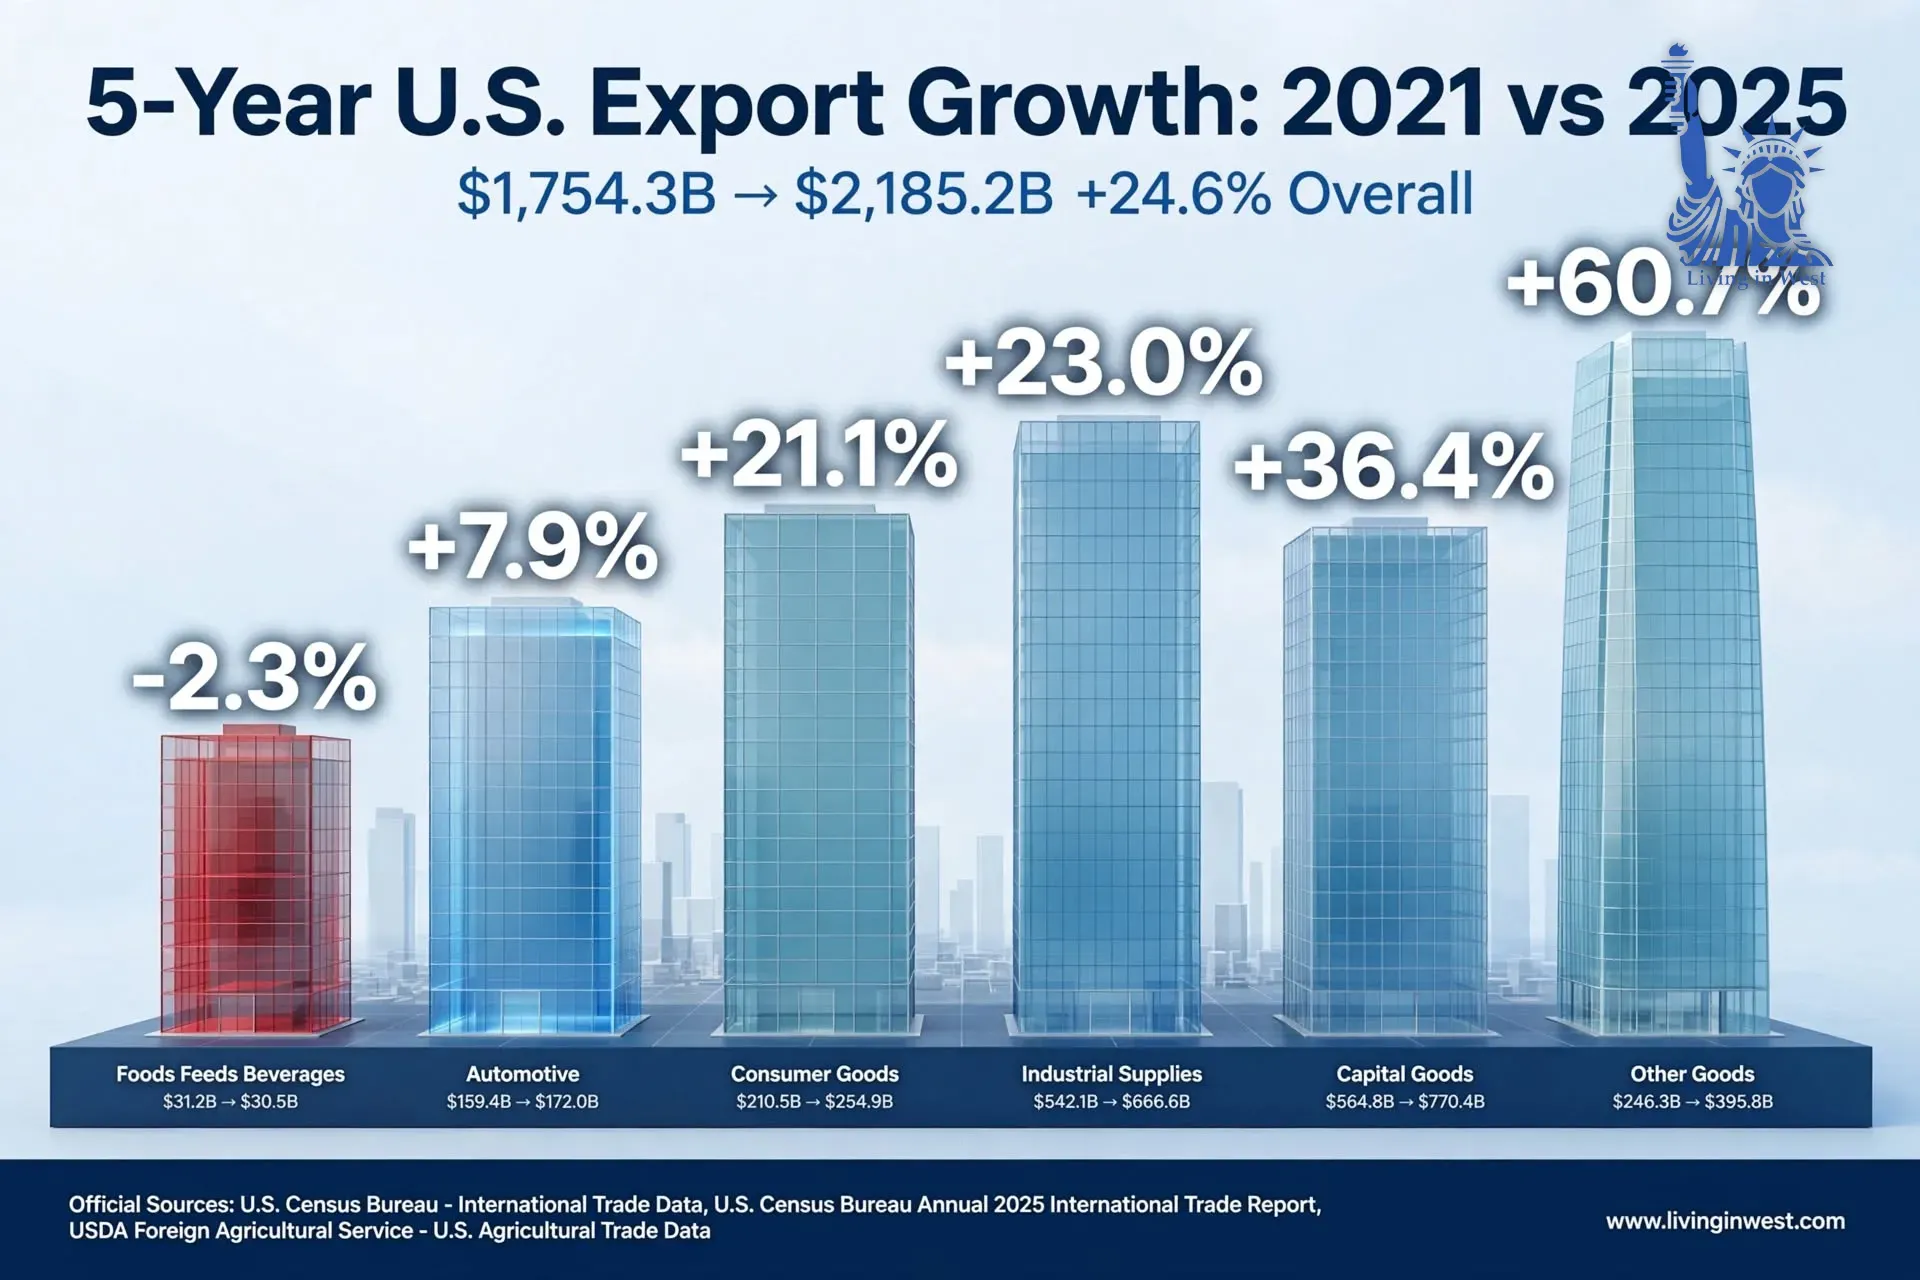
Now we can see the full five-year picture.
Total Goods Exports
2021: $1,754.3B
2025: $2,185.2B
Overall increase: approximately +24.6%
So U.S. merchandise exports grew by almost one-quarter in five years.
Major Category Growth
Industrial Supplies & Materials
$636.9B → $783.7B
Growth: +23.0%
This category includes petroleum, natural gas, metals, chemicals, plastics and other industrial materials.
Capital Goods
$520.6B → $710.3B
Growth: +36.4%
This is one of the biggest stories of the five-year period. Capital goods include computers, aircraft, aircraft engines, semiconductors, machinery, medical equipment and telecommunications equipment.
Consumer Goods
$222.2B → $269.2B
Growth: +21.1%
Pharmaceuticals are particularly important in this category.
Automotive
$144.1B → $155.4B
Growth: +7.9%
Although automotive exports increased over the five-year period, 2025 was considerably weaker than 2024.
Foods, Feeds & Beverages
$164.7B → $161.0B
Change: −2.3%
This is important because it shows that America's overall export growth was not primarily driven by agriculture.
Other Goods
$65.8B → $105.8B
Growth: +60.7%
This was the fastest percentage increase among these broad Census export categories, although it is much smaller than capital goods or industrial supplies in absolute dollar value.
Final 5-Year Summary
2021 → 2022
$1.754T → $2.065T = +17.7%
This was the strongest annual percentage increase. Industrial supplies, particularly energy and petroleum-related exports, drove much of the increase.
2022 → 2023
$2.065T → $2.020T = −2.1%
Exports cooled after the huge 2022 jump. Industrial supplies and food exports declined, while capital goods and automobiles continued to perform relatively well.
2023 → 2024
$2.020T → $2.062T = +2.0%
The export economy returned to growth. Capital goods became the major growth engine, particularly computers, aircraft engines, semiconductors and computer accessories.
2024 → 2025
$2.062T → $2.185T = +6.0%
The U.S. reached a new five-year record. Capital goods and industrial supplies were the biggest contributors, while automotive exports declined.
2021 → 2025
$1.754T → $2.185T = +24.6%
Over five years, America's merchandise-export economy expanded by nearly 25%.
What Are America's Biggest Exports?
The five-year data shows that the United States is not dependent on one export product.
America exports:
- Computers and computer equipment
- Semiconductors
- Aircraft
- Aircraft engines and parts
- Industrial machinery
- Medical equipment
- Pharmaceuticals
- Passenger cars
- Automotive parts
- Crude oil
- Petroleum products
- Natural gas
- Gold and other metals
- Chemicals
- Plastics
- Soybeans
- Corn
- Wheat
- Rice
- Meat and poultry
- Nuts
- Dairy products
- Consumer products
The data also makes one thing very clear: America's export economy is much larger and more diversified than agriculture alone. Capital goods, industrial materials, energy, technology, aerospace, pharmaceuticals and automobiles all play major roles.
Important Data Note
All five-year headline figures in this article use the U.S. Census Bureau's Census-basis goods-export data. Census says its goods export values are reported on an F.A.S. basis and that industrial supplies include petroleum and petroleum products.
USDA's agricultural-export database uses a different agricultural classification and therefore may show different values for individual products such as soybeans and corn. For example, USDA's 2025 agricultural data reports total U.S. agricultural exports of $171.49B, with corn at $18.55B and soybeans at about $16.2B.
For that reason, Census figures should be used for the overall U.S. export story, while USDA figures are best used when specifically discussing agricultural exports.
Official Sources
- U.S. Census Bureau — International Trade Data
- U.S. Census Bureau — Annual 2025 International Trade Report
- USDA Foreign Agricultural Service — U.S. Agricultural Trade Data

Editorial Team